

March 07, 2016
March 7, 2016
This Graphics Economics post is a companion piece to a recently published CEPR blog post titled Should Poor Workers Receive Less Social Security Because Rich Workers Are Living Longer?
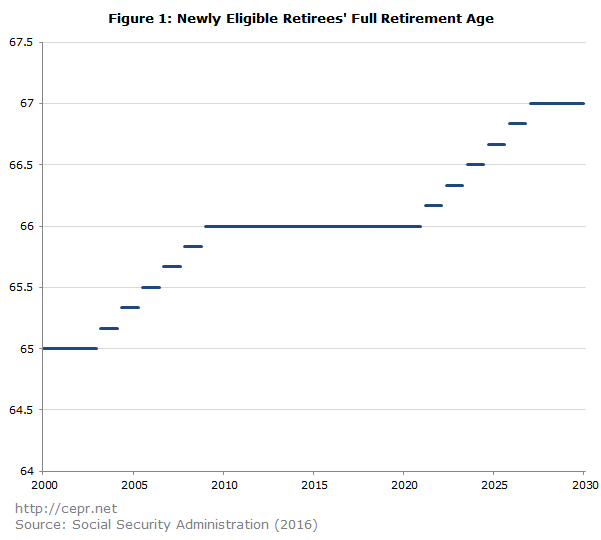
In 1983, President Reagan signed a bill which authorized future increases in the Social Security Full Retirement Age (SSFRA). Since the creation of Social Security, the SSFRA had always been 65. The 1983 reforms set in place a series of 12 different increases in the SSFRA which will raise it to 67 by 2027.
This is depicted in Table 1 below.
Table 1
|
Year of Birth* |
Social Security Full Retirement Age (SSFRA) |
|
1937 or earlier |
65 |
|
1938 |
65 and 2 months |
|
1939 |
65 and 4 months |
|
1940 |
65 and 6 months |
|
1941 |
65 and 8 months |
|
1942 |
65 and 10 months |
|
1943–1954 |
66 |
|
1955 |
66 and 2 months |
|
1956 |
66 and 4 months |
|
1957 |
66 and 6 months |
|
1958 |
66 and 8 months |
|
1959 |
66 and 10 months |
|
1960 and later |
67 |
Source: Social Security Administration (2016).
Figure 1 shows how this has translated to a higher SSFRA and how the SSFRA will continue to rise through 2027.
Notably, the increase in the SSFRA from 65 to 66 has occurred over a time period during which life expectancy at age 65 barely increased for men in the bottom half of the earnings distribution. Table 2 shows the life expectancy at age 65 for men in the bottom and top halves of the earnings distribution from 1987 to 2006.
Table 2
Life Expectancy at Age 65, Men
|
Bottom Half of Earnings Distribution |
Top Half of Earnings Distribution |
|
|
1987 |
15.3 years |
17.5 years |
|
1992 |
15.5 years |
18.5 years |
|
1997 |
15.7 years |
19.6 years |
|
2002 |
16.0 years |
20.6 years |
|
2006 |
16.1 years |
21.5 years |
Source: Waldron (2007).
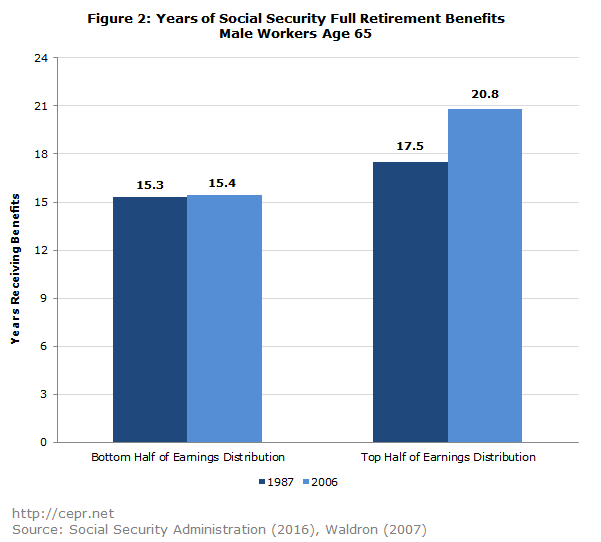
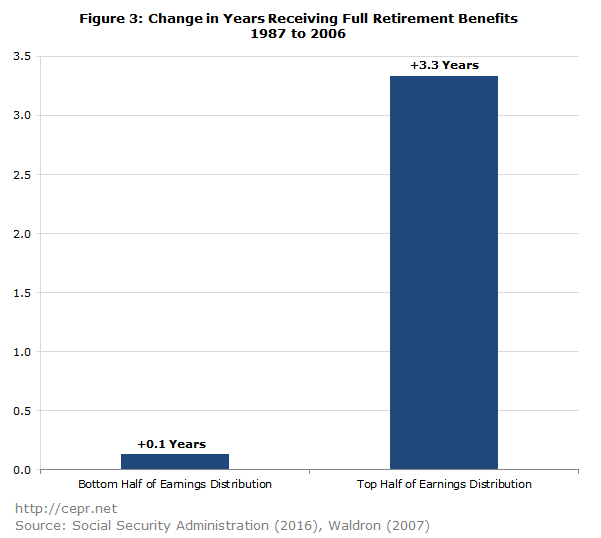
Between 1987 and 2006, the combination of an eight-month increase** in the SSFRA and a 9.6-month increase in life expectancy meant that men in the bottom half of the earnings distribution saw almost no change in the number of years they could expect to receive full retirement benefits. This is depicted in Figures 2 and 3 below.
Between 2006 and 2027, the SSFRA will be raised from 65 and 8 months to 67. If increases in life expectancy over that 21-year period mimic the increases from the previous 19 years, the disparity in years of full retirement benefits will be even more significant. Over the 40-year period from 1987 to 2027, men in the bottom half of the earnings distribution will receive 0.3 fewer years of full retirement benefits, while men in the top half will receive an additional 6.4 years. This is depicted in Figure 4 below.

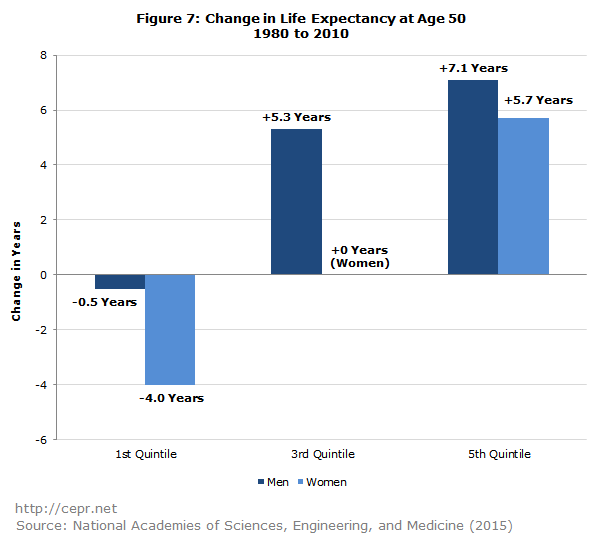
A more recent study by the National Academies Press (NAP) looked at changes in life expectancy for 50-year-olds by income quintile. While this isn’t quite as relevant for Social Security’s finances as life expectancy at age 65, the NAP data is useful because it allows for more exact breakdowns along the income distribution. Figures 5 and 6 show the expected remaining years of life for 50-year-old men and women, respectively, in 1980 and 2010.

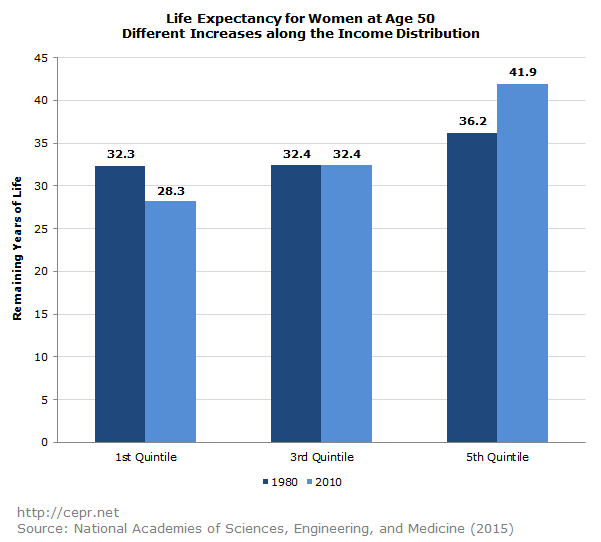
As can be seen in Figure 7, workers in the bottom fifth of the income distribution have actually seen their life expectancy fall over the past 30 years. (Due to a small sample size, the estimates for women are less precise than the estimates for men.)
Since the Social Security reforms of the early 1980s, low-wage workers have seen slow growth or even reductions in life expectancy. The two-year increase in the SSFRA will leave such workers with fewer years of full benefits than their parents received.
*Anyone born on the first day of a given month is allowed to count their birthday as falling during the previous month for the purposes of receiving Social Security benefits. This means that someone born on January 1st of a given year actually has the same SSFRA as someone born in the previous December.
**As shown in Table 2, the SSFRA is 65 and 6 months for the first six months of 2007 and rises to 65 and 8 months in September. However, in comparison with the Waldron (2007) study, this is an eight-month increase in the SSFRA. Waldron (2007) looks at men turning 65 in 2006; this means that they were born in 1941. And as Table 1 shows, the SSFRA is 65 and 8 months for everyone born in 1941.
Sources:
National Academies of Sciences, Engineering, and Medicine. 2015. “The Growing Gap in Life Expectancy by Income: Implications for Federal Programs and Policy Responses.” Washington, DC: The National Academies Press, Committee on the Long-Run Macroeconomic Effects of the Aging U.S. Population-Phase II. Committee on Population, Division of Behavioral and Social Sciences and Education. Board on Mathematical Sciences and Their Applications, Division on Engineering and Physical Sciences.
Social Security Administration. Accessed February 2016. “Retirement Planner: Full Retirement Age.” Woodlawn, MD: Social Security Administration.
Waldron, Hilary. 2007. “Trends in Mortality Differentials and Life Expectancy for Male Social Security–Covered Workers, by Average Relative Earnings.” Woodlawn, MD: Social Security Administration, Office of Policy.

