Article
A Brief Look at Low-Income Asian Americans and Pacific Islanders

Article
Asian Americans have the highest median household income of the major racial and ethnic groups in the US. But the story of Asian Americans and Pacific Islanders and the US economy is more complicated than might be apparent at first. This article challenges the model minority myth that hides significant numbers within the AAPI population with low incomes that could benefit from government assistance.
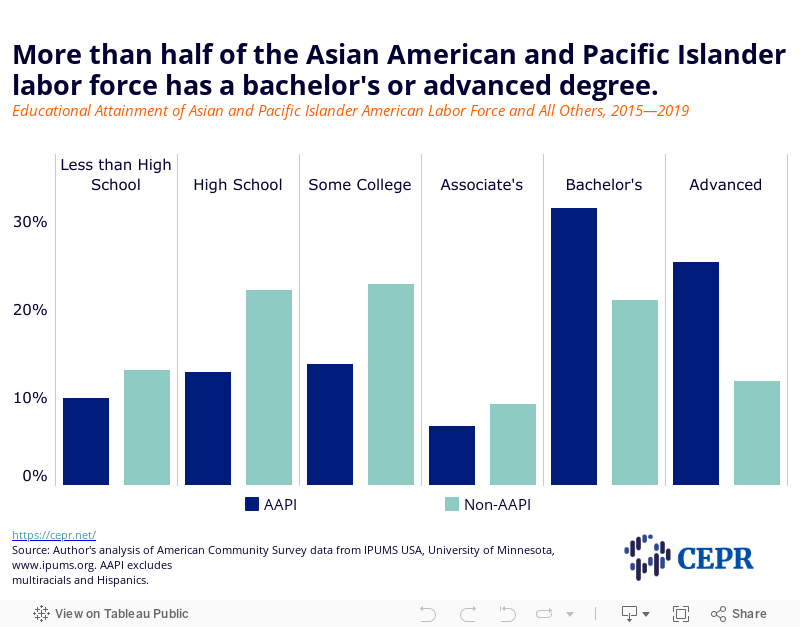
Educational Attainment of AAPI Labor Force
Since 1965, US immigration policy has favored immigrants with higher levels of education
and professional skills. Asian immigrants with the right credentials benefitted from these policies, and it is an important factor behind Asian Americans’ high income. Because a parent’s educational level is a powerful predictor of their child’s, the children of high-socioeconomic-status Asian immigrants are likely to have a similar status.
Figure 1 shows that more than half (56.8 percent) of the Asian American and Pacific Islander (AAPI) labor force has a bachelor’s or advanced degree. For the rest of the labor force, only about a third (32.7 percent) have similar degrees. Ninety-seven percent of the AAPI population is of Asian descent, so the statistics largely reflect the Asian American population. Workers with higher levels of education tend to have higher earnings.
Figure 1
Another factor influencing Asian American incomes is that they are concentrated in high-cost-of-living states. Table 1 shows that more than half (55.8 percent) of the AAPI labor force lives in the 10 states that CNBC ranked as the most expensive. Only about a quarter (27 percent) of the non-AAPI labor force resides in these states. In high-cost-of-living states, people tend to earn more so this fact would contribute to higher Asian American earnings.
More than half of the AAPI labor force lives in the most expensive states
| State | AAPI | Non-AAPI | |
|---|---|---|---|
| Alaska | 0.3% | 0.2% | |
| California | 31.4% | 10.9% | |
| Connecticut | 0.9% | 1.2% | |
| Hawaii | 3.5% | 0.3% | |
| Maryland | 2.2% | 2.0% | |
| Massachusetts | 2.5% | 2.3% | |
| New Jersey | 4.7% | 2.8% | |
| New York | 8.8% | 5.9% | |
| Oregon | 1.1% | 1.3% | |
| Rhode Island | 0.4% | 0.2% | |
| 10-State Total | 55.8% | 27.0% |
* The 2020 10 highest-cost-of-living states are found in Scott Cohn, “These are America’s 10 most expensive states to live in,” CNBC.com, July 15, 2021, https://www.cnbc.com/2021/07/15/these-are-americas-most-expensive-states-to-live-in.html.
Source: Author’s analysis of 2015-2019 American Community Survey data from IPUMS USA, University of Minnesota, www.ipums.org. AAPI excludes multiracials and Hispanics.
Income Inequality in Asian American and Pacific Islander Populations in US
While high-income AAPIs receive a great deal of attention, there are also low-income AAPIs. Although there is considerable variation in rates, low-income AAPIs can be found among all the AAPI subpopulations and in all states.
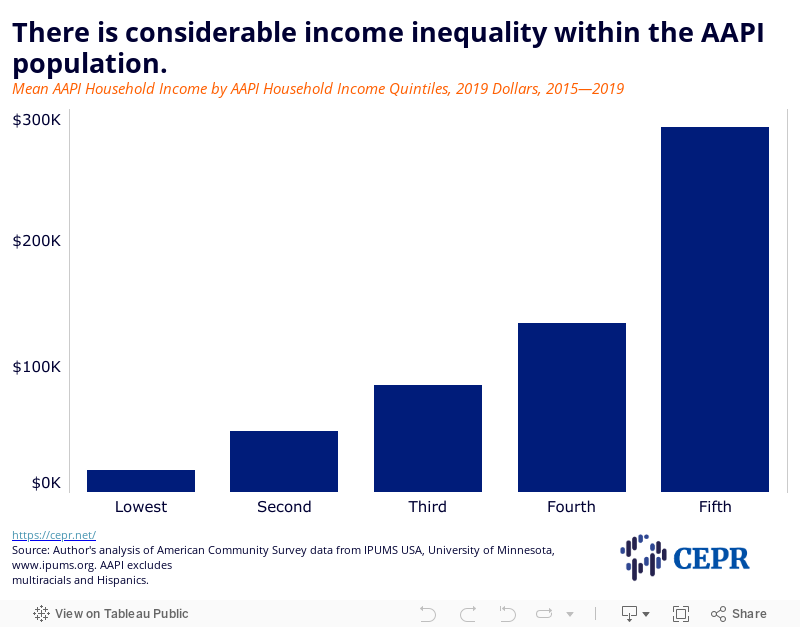
As the Center for Economic and Policy Research (CEPR) has documented previously, there is considerable economic inequality within the AAPI population. Figure 2 illustrates this inequality. The average income in the highest AAPI income quintile is $289,232. This amount is 16 times the average income of the lowest income quintile ($17,743). This finding should remind us that while the median income is a useful statistic, it does not tell us much about the income range and its distribution.
Figure 2
Low-Income Asian Americans and Pacific Islanders
The remainder of this article will focus on the low-income AAPI population. “Low-income” is defined as people living in households in the lowest AAPI income quintile. Again, we are highlighting the inequality within the AAPI population.
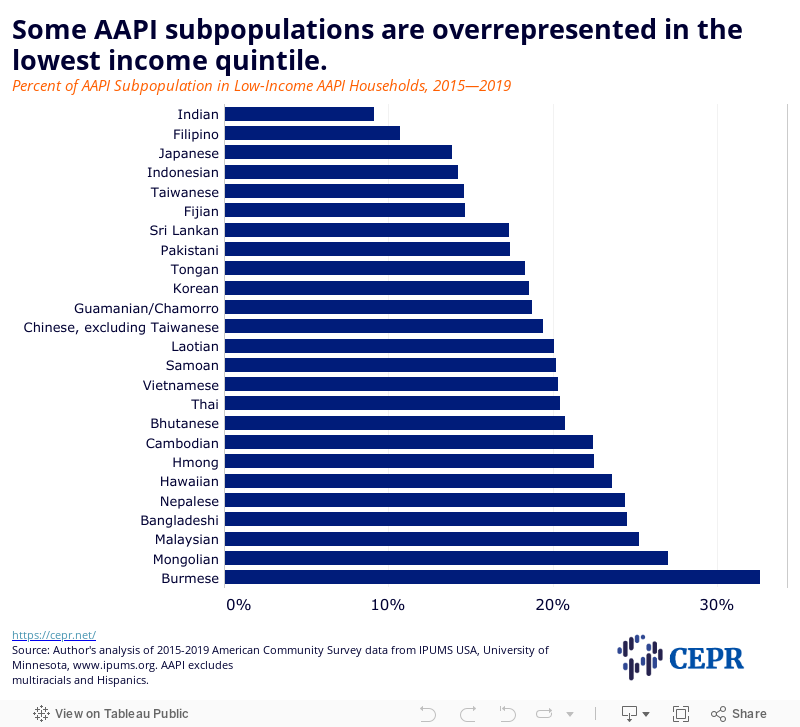
As a whole, the AAPI population is economically diverse. Looking at income by national origin in Figure 3, we also see economic diversity. At the extremes, only 9.1 percent of the Indian American population is low-income, compared to 32.6 percent of the Burmese American population. In the middle, 20 percent of the Laotian American population is low-income.
Figure 3
States Where AAPIs Are More Likely to be Low-Income
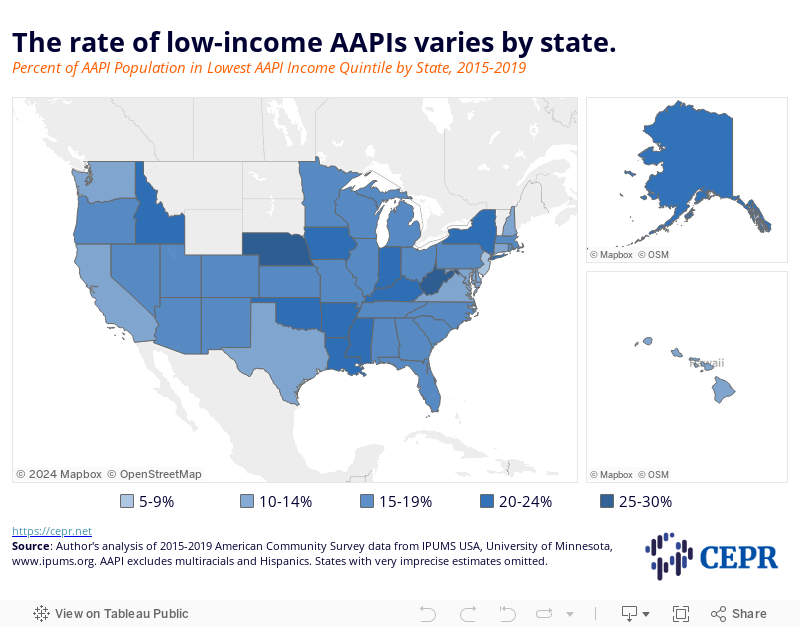
Low-income AAPIs can be found in all states, but some states have a larger share of the low-income AAPI population. In Nebraska, West Virginia, and Mississippi approximately a quarter of AAPI households are low-income. In New Jersey, Virginia, and Maryland only about a tenth of AAPI households are low-income. Michigan, Minnesota, and Nevada have rates in the middle with about 17 percent of low-income AAPI households (See Figure 4.)
Figure 4
To better assess the economic standing of the AAPI population by state, it would be valuable to apply a statewide measure of economic hardship that takes into account the cost of living within the state and other factors. CEPR will be exploring this issue in future work.