Article • Dean Baker’s Beat the Press
Nate Silver had a piece in the New York Times Monday arguing that people had good reason to be upset about the economy under Biden, and that it was not just perceptions that were out of touch with economic reality. Silver tells us:
“But it’s a mistake to assume that consumers have just been reacting to news accounts of high gasoline or fast-food prices instead of actually observing the impact on their bottom lines. People’s pocketbooks really aren’t in great shape — income growth has struggled to keep up with inflation.”
To make his point, he includes a graph of real (inflation-adjusted) per capita disposable income. This is a reasonable measure of people’s income, although it doesn’t quite show the story Silver claims. I have included the same graph but taken it back a bit further to the start of the Trump administration so that people can get a better sense of what is going on.
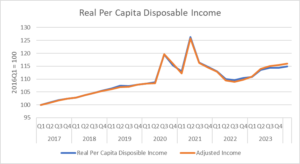
Source: NIPA Tables 2.1 and Table 1.7.5 and author’s calculations, see text.
As can be seen, there are big jumps in 2020 and 2021. These are primarily due to the pandemic checks that we got, first in the CARES Acts, passed while Trump was still president, but then a second round of $1,400 a person after Biden’s recovery package took effect. Income was also boosted by other pandemic relief programs such as expanded unemployment benefits and the expanded child tax credit.
These programs mostly went away after 2021, which explains most of the drop in 2022. That was also a year of sharp inflation, which outpaced wage growth for most workers. That further lowered real income.
However, we see a reversal in 2023. Wages substantially outpace inflation for the year. In addition, the rapid pace of job creation meant that a larger share of the population was working. As a result, real disposable income was considerably higher in the 4th quarter of 2023 than in the 4th quarter of 2019, before the pandemic hit.
To be precise, real per capita disposable income was 6.0 percent higher in the 4th quarter of 2023 than in the fourth quarter of 2019. We can debate what “struggled to keep pace with inflation means,” but we can also do a simple comparison. Between the 4th quarter of 2016, before Trump took office, and the 4th quarter of 2019, real per capita disposable income rose by 8.3 percent.
Now, 8.3 percent is obviously larger than 6.0 percent, and we’re looking at three years rather than four, but it is hard to believe that 6.0 percent growth over four years is serious hardship, while 8.0 percent over three years is great. It is also worth noting in passing that we had a worldwide pandemic that, in addition to killing tens of millions of people, disrupted economies and led to inflation everywhere.
If people were willing to accept a pandemic excuse for the ten million extra unemployed workers at the end of the Trump administration, it seems they would be willing to buy that the pandemic may have slowed income growth somewhat. If not, that sounds more like a story of perceptions than reality.
In any case, there are some other factors that make the story of the Biden economy look better than the 6.0 percent growth figure. First, I have included an “adjusted” line for per capita disposable income alongside the line with the published data from the Bureau of Economic Analysis.
This adjustment takes account of the fact that there has been an unusual gap between measured GDP growth and measured growth in gross domestic income over the last couple of years. This is unusual since in principle we are measuring the same thing.
We can either measure GDP by adding up the goods and services produced, or we can add up the incomes generated in the production process (wages, profits, interest, etc.). The two numbers are never exactly the same, but they usually end up being pretty close.
In the last two years they have grown far apart, with GDP measured on the output side exceeding the income measure by 2.4 percent in the third quarter. (We don’t have fourth quarter data available yet, so I have assumed the same gap persisted into the fourth quarter.)
Revisions to the data usually bring the two measures closer in line, but given the data we have, it is normal to assume that the true figure will be somewhere in the middle. For my adjusted line, I assume that the true measure of GDP and income growth is halfway between the two reported measures. Making this assumption raises real per capita income growth under Biden to 7.0 percent. That is still less than under Trump but seems pretty far from a struggle to keep pace with inflation.
I’ll add two other important issues that are often overlooked in these discussions of living standards.
Mortgage Refinancing
There was a massive mortgage refinancing boom during the pandemic with 14 million households refinancing their mortgages. The New York Fed estimated that the 9 million households who refinanced without taking out additional money are saving an average of more than $2,500 a year.
The other five million took advantage of low interest rates and rising house prices to borrow more money against their home. The end of the refinancing boom brought an end to this channel of credit, leading to the increase in credit card debt that has gotten many analysts worried.
The savings on mortgage payments do not show up as an increase in disposable income in the GDP accounts. The reduction in mortgage interest payments translates into less interest income among lenders. However the lenders in this story tend to have higher income than the borrowers, so we might think this is in general a good story.
It is striking that this massive wave of refinancing is rarely mentioned in reporting on the economy, while the higher mortgage rates facing potential new home buyers are a frequent topic of reporting. There are many more people in the refinancing camp than potential first-time homebuyers.
Working from Home
There has been an explosion in the number of people working from home as an enduring effect of the pandemic. According to the Bureau of Labor Statistics, 38 million people worked from home on an average day last year. That’s an increase of more than 11 million from before the pandemic.
This is a huge benefit for these workers. The average amount of time spent commuting in 2019 was 27.6 minutes for a one-way trip, or 55.2 minutes for the round-trip. If we assume an eight-hour workday, time spent commuting added an average of 11.5 percent to the length of the workday. We can think of this as equivalent to an 11.5 percent reduction in the hourly pay rate, compared to a situation where no time is spent commuting.
Commuting to work doesn’t just take time, it is expensive. The average commuting distance to work is more than 15 miles. That means 30 miles for the round-trip. At the federal government’s mileage reimbursement rate of 62.5 cents per mile, this comes to $18.75 a day or almost $4,900 a year. That is 7.0 percent of the annual pay of a worker earning $70,000 a year.
It’s not just travel expenses that people save by being able to work at home. They can save on paying for business clothes, dry cleaning, and buying a purchased lunch at work. For many families, working from home may also save on childcare, insofar as they are able to care for young children without seriously disrupting their work.
In short, the option to work from home can mean large savings in time and money. Also avoiding traffic jams may mean a major quality of life improvement. It is true that the option to work from home is available primarily to the top half of earners, and especially the top fifth, but this is still a very large number that extends far beyond just the rich.
The Data Don’t Support the Complaints About the Economy
The basic story here is that we have seen improvement in living standards for most of the population during Biden’s term in office. Even if we just take Silver’s measure of real per capita disposable income, there were healthy gains, even if not as rapid as during the Trump presidency.
We have also seen substantial reductions in wage inequality in the Biden years. The wage gains were strongest at the bottom end of the wage distribution.
It seems implausible that anger about the economy can be based on the somewhat slower rate of income growth in the Biden year. This is especially the case when we consider that the economy was whacked by a worldwide pandemic, which ended up hurting other economies far more than the U.S.
The public was largely willing to forgive Trump for the high unemployment created by the pandemic, if it’s not willing to forgive Biden for its negative impact on the economy that reflects something other than objective reality. In other words, the media is failing to point out the impact of the pandemic on inflation and growth.
And the Silver measure of income does not include the gains to tens of millions of households from refinancing mortgages and the increased ability to work from home. We know from polling that people are not happy about the economy, but contrary to what Silver would have us believe, there is not a case for their unhappiness in the economic data.