


Readers may have missed this fact, but this is what the NYT said in an article on the prospect for tax reform when it told readers:
“Democrats have also been deeply skeptical of the Trump administration’s plans to repeal the estate tax, which it has said has been harmful to family farmers.”
If the Trump administration has been saying the estate tax has been harmful to family farmers it is lying since virtually no family farmers will owe a penny as a result of the estate tax. This would be known to NYT since the paper ran a piece 16 years ago which noted that the American Farm Bureau Federation, a strong opponent of the estate tax, could not identify a single person who had lost a family farm as a result of the estate tax.
Read More Leer más Join the discussion Participa en la discusión
According to an article in Sunday’s paper, employers are now able to find the workers they need by going to cities with large amounts of unemployment or underemployment.
According to an article in Sunday’s paper, employers are now able to find the workers they need by going to cities with large amounts of unemployment or underemployment.
Read More Leer más Join the discussion Participa en la discusión
The Census Bureau reported that the percentage of people without health insurance fell by 0.3 percentage points in 2016 to 8.8 percent. This puts the cumulative gain in coverage since 2013, when the main Affordable Care Act provisions took effect, at 4.5 percentage points.
By state, the largest drop in the percent of the population that is uninsured was in California, which had a decline of 9.8 percentage points to 7.3 percent. Next was New Mexico with a decline of 9.5 percentage points, giving it an uninsurance rate of 9.2 percent, and Nevada with a drop of 9.3 percentage points to 11.4 percent.
The smallest decline over this period was in Massachusetts, where the percent uninsured fell by just 1.2 percentage points, but this is due to the fact that it had an uninsured rate of just 3.7 percent in 2013. Wyoming had the second smallest decline, with the rate falling by 1.3 percentage points to 11.5 percent.
Texas, Alaska, and Oklahoma had the highest uninsured rate in 2016, at 16.6 percent, 14.0 percent, and 13.8 percent, respectively. The lowest rates were in Massachusetts, 2.5 percent, Hawaii, 3.5 percent, and Vermont, 3.7 percent.
By employment, the biggest increase in coverage was among those working part-time. The percentage uninsured among this group fell by 9.0 percentage points to 14.8 percent. For those who did not work at all, the percent of uninsured fell by 7.4 percentage points to 15.0 percent. For full-time, full-year, workers the drop was 4.1 percentage points to 9.8 percent.
On the whole, these newest numbers indicate that Obamacare has succeeded somewhat more than expected in extending coverage. The biggest beneficiaries have been people who choose to work part-time (80 percent of part-time employment is voluntary), who no longer need to get coverage through an employer as a result of the exchanges and the expansion of Medicaid.
Note: Percent of uninsured for Wyoming has been corrected; thanks, Charles Angevine.
Read More Leer más Join the discussion Participa en la discusión
Read More Leer más Join the discussion Participa en la discusión
If you thought the pharmaceutical industry couldn’t possibly sink any lower in its pursuit of profits, Allergan just proved you wrong. The geniuses at Allergan came up with the brilliant idea of turning over one of its patents on the dry-eye drug Restasis to the Mohawk tribe. The tribe will then lease the patent back to the Allergan.
The reason for this silly trick is that the Mohawk tribe, based on its sovereign status, is disputing the right of generic competitors to pursue a case before the Patent Trial and Appeal Board. This board is supposed to determine whether a patent was appropriately granted in the first place.
The article may have left readers confused about the issues involved when it reported without comment a statement by Allergan’s lawyer, which claimed that they were trying to avoid double jeopardy since the company also faces a case in federal court. The additional background here is that there is an enormous asymmetry in legal cases involving patents. The patent holder is fighting for the right to sell a drug in a monopoly market, which means monopoly profits. The challenger(s) is fighting for the right to be able to sell the drug in a competitive market, which means normal profits.
In this context, the patent holder has an enormous incentive to delay and run up the cost of litigation, which may quickly prove unprofitable to the generic competitor. The Patent Trial and Appeal Board was created to allow a quicker lower cost process to challenge invalid patents. It is also worth noting that Allergan’s revenue on this drug (more than $1.3 billion annually, according to the article) can be thought of as a tax on the American public. Without this patent, the drug would likely sell for 20 percent or less of its patent-protected price.
Read More Leer más Join the discussion Participa en la discusión
Okay, they haven’t written anything about too many iPhones that I know of, but the paper continually displays its irrational fear of too much government borrowing. It did so yet again in a discussion of plans to temporarily raise the debt ceiling and possibly to get rid of it altogether. The piece presents the views of the Peter Peterson-funded Committee for a Responsible Federal Budget that the country faces a serious debt and deficit problem.
The evidence of a problem with debt and deficits would be high interest rates and/or inflation. In fact, interest rates remain extraordinarily low, as does the inflation rate, which has been persistently below the Federal Reserve Board’s target of a 2.0 percent average inflation rate. The debt is not even a serious measure of generational balance as it is often used. The austerity that has resulted from concerns over the debt has cost us tens of trillions of dollars of future output, making our children and grandchildren far poorer than if we had pursued sound macroeconomic policies in the years following the Great Recession.
It would be helpful if the Washington Post had economics-based discussions of debts and deficits rather than hyping the irrational fears promoted by a Wall Street billionaire.
Read More Leer más Join the discussion Participa en la discusión
The New York Times told readers this morning that the European Central Bank (ECB) would like to cut back on its quantitative easing program but is reluctant to do so because of the weak dollar. The piece notes that a weak dollar reduces the euro zone’s trade surplus with the United States. Also by making low-cost imports available, it undermines the ECB’s effort to raise inflation to its 2.0 percent target.
The piece explains the weak dollar:
“There’s not much Mr. Draghi can do about the weak dollar, which analysts say reflects pessimism about the ability of President Trump and Congress to agree on legislation that many economists believe would help goose growth in the United States, such as infrastructure programs or corporate tax reform.
“‘Investors no longer trust the American government to push through tax reform and fiscal stimulus,’ Alwin Schenk, a portfolio manager at the German bank Sal. Oppenheim, said in a note to clients.
“The dollar’s decline is also an expression of the nervousness investors feel about geopolitics, primarily nuclear saber-rattling by North Korea and bellicose rhetoric from Mr. Trump. The euro is seen as a safe haven from the turmoil.”
This would be a compelling story except for the fact that the dollar is actually quite high relative to euro, as can be seen.
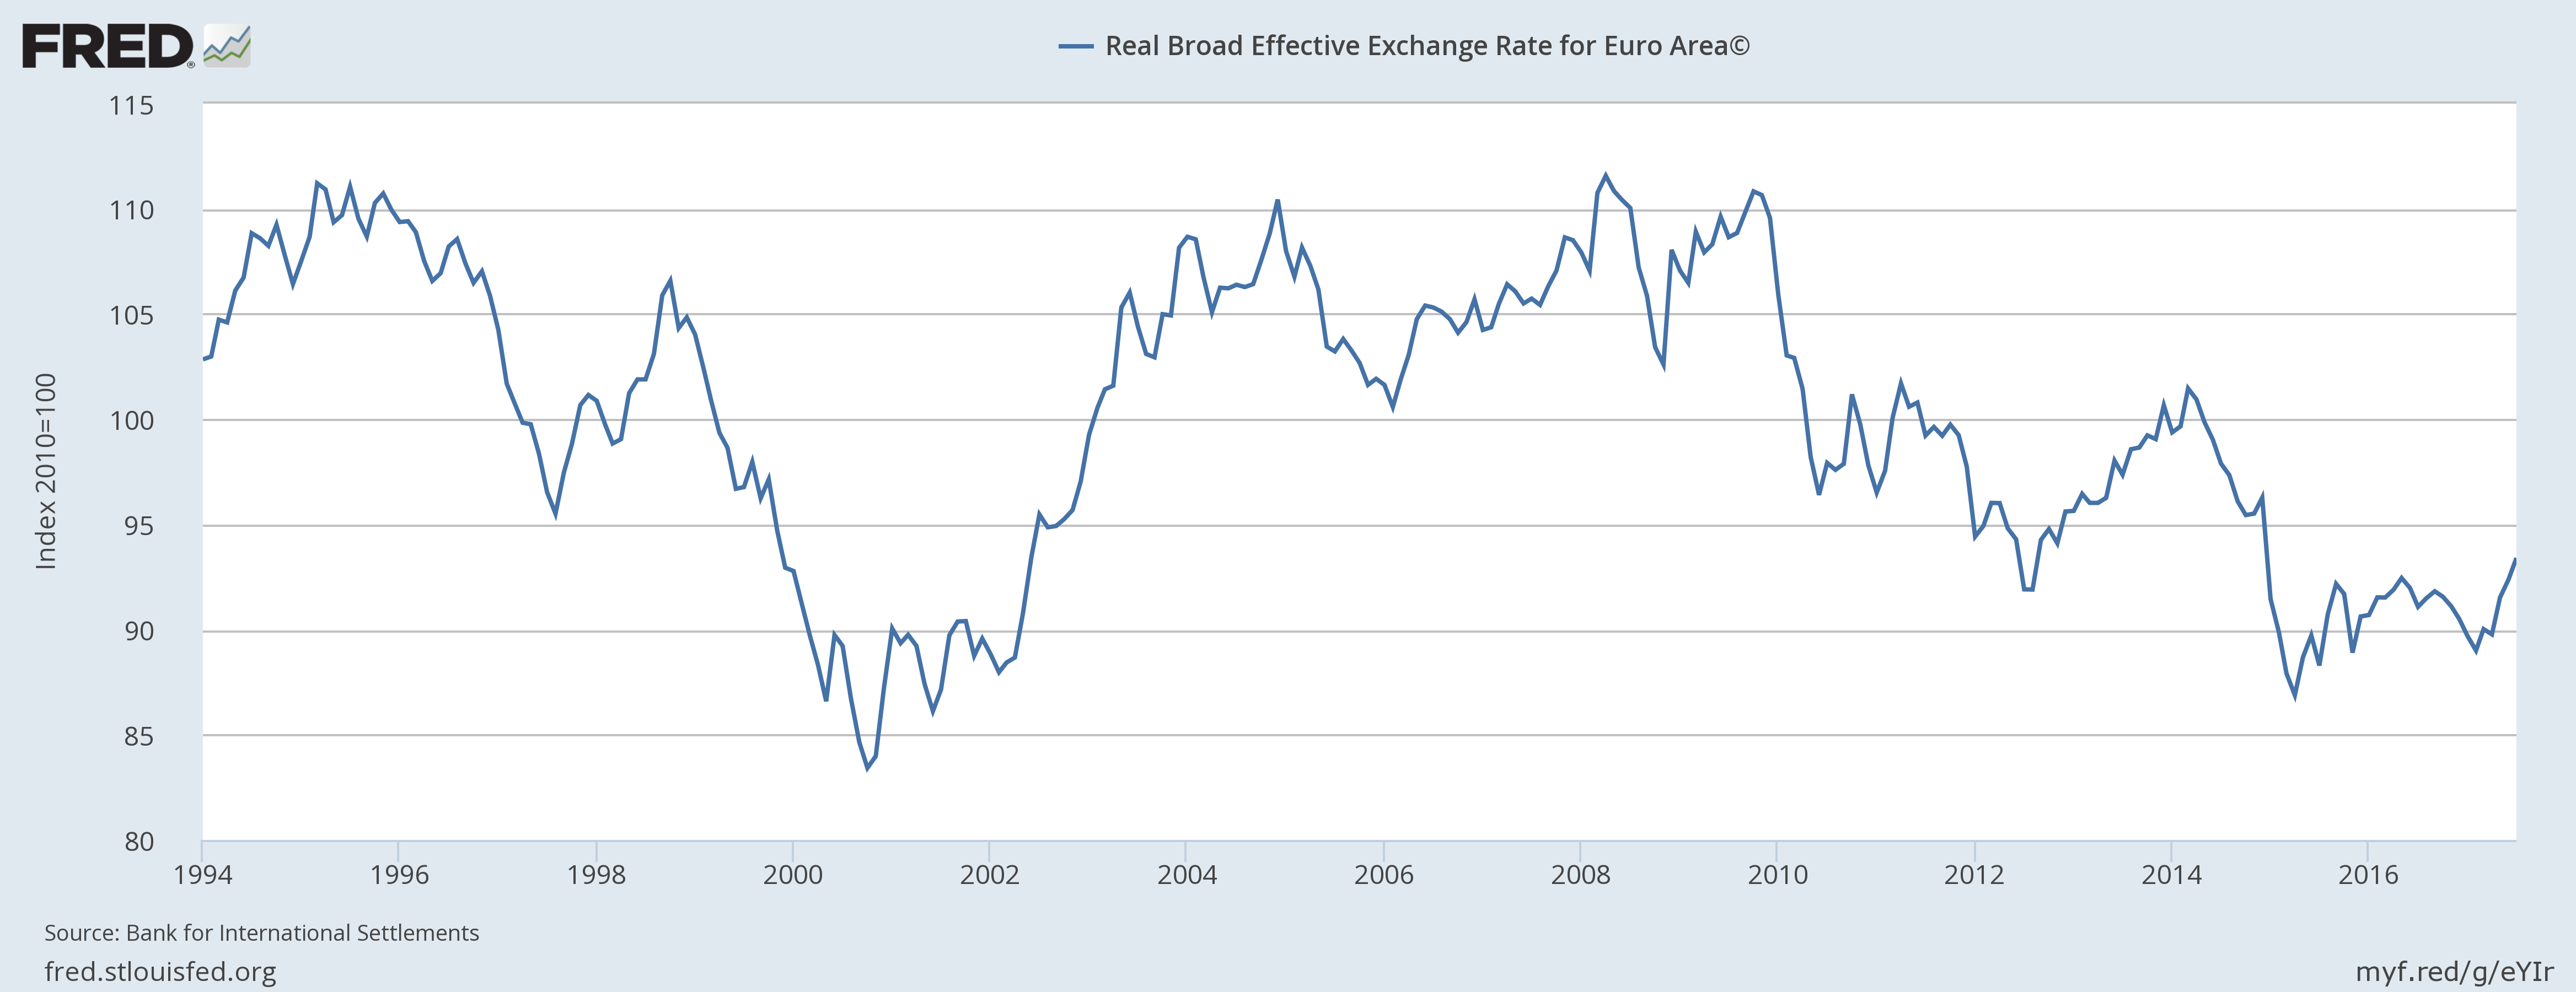
The real value of the dollar measured against the euro is well below its average since its creation. It is more than 15 percent below the peaks hit in the middle of the last decade. While the dollar is down from its value last year, this follows a long period in which its value increased by more than 20 percent in value against the euro. (The chart shows the value of the euro, so a drop means a rise in the value of the dollar.) The complaint about a low dollar is especially bizarre since the United States has a trade deficit and the euro zone has a trade surplus.
Hopefully, this confusion about the value of the dollar stems from the NYT’s reporting and does not represent the actual thinking at the ECB.
The New York Times told readers this morning that the European Central Bank (ECB) would like to cut back on its quantitative easing program but is reluctant to do so because of the weak dollar. The piece notes that a weak dollar reduces the euro zone’s trade surplus with the United States. Also by making low-cost imports available, it undermines the ECB’s effort to raise inflation to its 2.0 percent target.
The piece explains the weak dollar:
“There’s not much Mr. Draghi can do about the weak dollar, which analysts say reflects pessimism about the ability of President Trump and Congress to agree on legislation that many economists believe would help goose growth in the United States, such as infrastructure programs or corporate tax reform.
“‘Investors no longer trust the American government to push through tax reform and fiscal stimulus,’ Alwin Schenk, a portfolio manager at the German bank Sal. Oppenheim, said in a note to clients.
“The dollar’s decline is also an expression of the nervousness investors feel about geopolitics, primarily nuclear saber-rattling by North Korea and bellicose rhetoric from Mr. Trump. The euro is seen as a safe haven from the turmoil.”
This would be a compelling story except for the fact that the dollar is actually quite high relative to euro, as can be seen.
The real value of the dollar measured against the euro is well below its average since its creation. It is more than 15 percent below the peaks hit in the middle of the last decade. While the dollar is down from its value last year, this follows a long period in which its value increased by more than 20 percent in value against the euro. (The chart shows the value of the euro, so a drop means a rise in the value of the dollar.) The complaint about a low dollar is especially bizarre since the United States has a trade deficit and the euro zone has a trade surplus.
Hopefully, this confusion about the value of the dollar stems from the NYT’s reporting and does not represent the actual thinking at the ECB.
Read More Leer más Join the discussion Participa en la discusión
Just in case you were wondering how big a deal this is for the budget. Put another way, it is equal to about $25 for every person in the country. It might have been helpful to include such information in this NYT piece given the paper’s commitment to putting numbers in context.
Just in case you were wondering how big a deal this is for the budget. Put another way, it is equal to about $25 for every person in the country. It might have been helpful to include such information in this NYT piece given the paper’s commitment to putting numbers in context.
Read More Leer más Join the discussion Participa en la discusión
In listing bad things that Donald Trump is doing for the economy, Washington Post business reporter Heather Long included his threat to end the trade deal with South Korea. The piece noted that U.S. beef exports to South Korea topped $1 billion last year. While this is intended to be a big deal, it is not clear that it is.
This amount is roughly 1.5 percent of total beef production. More importantly, it is wrong to imply that this output would just sit and rot if the trade deal were cancelled. While South Korea might reduce its imports of beef from the United States, it is unlikely they would go to zero even if the deal was cancelled. If the U.S. is the lowest cost provider of beef to South Korea, the government would effectively be punishing its own people by denying access to U.S. beef. Democratically elected governments usually don’t think it’s good politics to punish their people.
The other point is that insofar as U.S. beef exports to South Korea are replaced by another supplier, it will be opening up a new potential market for the United States. For example, if Brazil, the world’s #2 beef producer, began exporting another $500 million in beef to South Korea, by diverting exports that had previously gone to other countries, then these other countries would offer a new potential market to the United States.
It will be the case that the result of Trump cancelling the trade deal will be somewhat lower U.S. beef exports, resulting in beef producers getting slightly lower prices in the United States, but the idea that this would be some sort of catastrophe for them does not make sense. (FWIW, I think it is a bad idea to pull out of the trade deal.)
The piece also attributes the fall in the stock market yesterday to the uncertainties created by Trump’s threats on the trade deal, ending DACA, and the risks of war with North Korea. While this is possible, it is also possible that investors are getting concerned that they will not see the promised tax cuts as the recovery from Harvey just increases the congressional agenda for the fall. It is also possible that the fall had nothing to do with anything, which is often the case with stock market fluctuations.
Addendum:
I forgot to add that if the prices received by domestic beef producers falls, this means lower prices to consumers in the United States, which will free up more money to spend on other items. This effect will almost certainly be trivial, but that’s because the impact of any changes in exports is likely to be trivial, in spite of the claims of highly paid lobbyists and the promoters of these trade deals in the media.
Read More Leer más Join the discussion Participa en la discusión
The average hourly wage has risen by 2.5 percent in the last year. We have that on pretty good data from Bureau of Labor Statistics. That’s okay in a context of inflation around 1.7 percent (it translates into 0.8 percent real wage growth) but hardly great. It is not keeping pace with trend productivity growth and is not allowing much catch-up from the bad years in the Great Recession and the immediate aftermath. It also indicates no acceleration from the last two years in spite of unemployment rates that are below the level at which point most economists expect wages to be accelerating.
There have been several efforts to pump up this number to make things look better. Robert Samuelson tells us about one, a study by the San Francisco Fed that shows the median wages of full-time workers who have stayed with the same employer for the last year has risen by 4.0 percent over the last year. While Samuelson (whose piece mistakenly links to this AEI publication rather than the San Francisco Fed paper) tell us that this gap is due to retiring baby boomers being replaced by lower paid younger workers, the study shows that only around 0.5 percentage points of this gap can be explained by retirements.
Furthermore, the study indicates that this effect depressed wages by around 0.2 percentage points in the years 2002–2007, so increasing retirements can only explain about 0.3 percentage points of the slowdown in wage growth compared to the first half of the last decade. The retirement of the baby boomers offers no help on the issue of wage growth not accelerating in the last year since the study indicates it has been somewhat less of a factor in this period than in 2015.
It is also worth recognizing what a narrow group of workers this is describing. These are workers who have been employed full-time by the same employer for at least a year. More than 27 million workers are presently employed part-time (22 plus million choose to work part-time). More than 5 million workers lose or leave their job every month. So this growth figure refers to a relatively privileged segment of the workforce. It is also a figure that includes a tenure and experience premium since by definition these workers have a year’s more experience in 2017 than they did in 2016.
It’s nice to see that Samuelson can cherry pick data to find groups that appear to be doing somewhat better than average, but this is not a way to seriously assess conditions in the labor market.
Read More Leer más Join the discussion Participa en la discusión


