


There is a steady drumbeat from people intent on making a major issue over the fact that many cities may have kept their schools closed for too long during the pandemic. The argument is that children were generally less susceptible to Covid than the rest of the population and closing schools did little to stem the spread of the pandemic.
Based on these facts, they argue that we had a massive preventable loss in learning. This loss is especially serious for children from under-privileged backgrounds, whose families do not have the resources to help their kids close the learning gap.
The places where schools had remote or hybrid classes longest were mostly cities with Democratic mayors and/or strong teachers unions. Therefore, we should blame these liberal types for hurting the people they ostensibly care about.
The latest piece of ammunition for these critics came in a study from a number of prominent researchers showing that children in schools that were closed for longer periods of time fell furthest behind during the pandemic. This effect was largest in the poorest school districts.
This study was written up in a major article in the New York Times. The piece noted that students in the schools closed longest fell more than half a year behind as a result of the pandemic.
There seem to be many people anxious to mispresent the findings of this study. While it does show that students fell further behind the longer their schools were closed, it also shows that the bulk of the learning loss was due to the pandemic, not the school closings.
In the schools that were closed for the shortest duration, students in grades 3 through 8, fell 0.35 years behind grade level on math scores. In the schools that were closed longest they fell 0.57 years behind. This means that the extra period of closing was responsible for a loss of 0.22 years, roughly 40 percent of the total. And this is the additional loss for schools that were closed longest compared to schools that were closed the shortest, most obviously fell somewhere in the middle.
Of course, it is better not to have students lose any ground in their education, especially those from under-privileged backgrounds. But we need to be clear that even in the most extreme cases the issue was the 0.22 years, not the full pandemic loss.
And requiring in-person instruction did pose real risks, if not to the students, certainly to teachers and their families. It is understandable that a teacher with a serious health condition, or who had a family member with a serious health condition, would be reluctant to expose themselves to the pandemic any more than absolutely necessary, at least until the vaccines were widely available. And it is certainly understandable that the unions that represented these teachers would act to protect them.
We can argue that the cities that gave in to pressure from teachers and their unions made the wrong call, but we need to have a clear eye of what was at stake. It was 0.22 years of learning – definitely an unfortunate loss, but probably not something we would consider a disaster in most contexts.
Vaccines for the World?
While the New York Times has ample space for the argument that we kept schools closed longer than necessary, it’s worth noting something that we don’t see widely being relitigated: the availability of vaccines, as well as tests and treatments. Given the extraordinary nature of the worldwide Covid pandemic, it would have been reasonable to suspend normal rules on patents and intellectual property and have worldwide sharing of technology related to vaccines, tests, and treatments.
This would have meant an international agreement where the United States, Europe, China, India, and everyone else involved in research related to the pandemic would agree to make all their relevant technology fully open. This means putting everything up on the Internet so that researchers everywhere had access to the same knowledge that they could criticize and build on.[1]
It also meant that as soon as a technology was shown to be successful, anyone anywhere could take advantage of it. There have been many boasts about the speed with which Operation Warp Speed developed effective vaccines. This was indeed impressive, but effective vaccines were also developed in roughly the same time frame in China and Europe, and only a little bit slower in India and Cuba.
Vaccines were in short supply in much of the world in 2021 and into 2022. If all the vaccines were fully open-sourced, so that anyone could produce them, we almost certainly would have vaccinated the bulk of the world’s population much more quickly. This would have hugely slowed the spread, likely preventing the development of the omicron strain and possibly even the delta strain. Millions of lives could have been saved and tens of millions of infections prevented.
Would all the countries of the world have agreed to this sort of pandemic cooperation? We’ll never know, but we do know that we didn’t try and the failure to have such cooperation was enormously costly in terms of lives lost, health, and economic damage.
It might be worth giving some thought to this issue. We can spend as much time as we want beating up liberals for respecting teachers’ health concerns, at the cost of 0.2 years of lost learning. But maybe we can also spend a little time asking if there are not ways to do medical research that better serve society, even if they may perhaps not be as good for the pharmaceutical industry’s profits.
[1] We could compensate companies after the fact for the profits that they lost due to the sharing of their technology.
Read More Leer más Join the discussion Participa en la discusión
It’s amazing how so many arguments in policy circles are transparently self-contradictory. Ross Douthat gave us a fantastic example in a NYT column defending Donald Trump’s bloodbath comment.
Douthat defends Trump by arguing that his bloodbath referred to the need to protect the U.S. auto industry from Chinese cars. This is arguably what Trump meant, but not what he said. I suppose we can give a pass to someone in Donald Trump’s mental condition.
But the neat part of the story is that Douthat goes on to criticize the plans announced by the E.P.A. to accelerate the switch to electric cars. Douthat argues that this is terrible politics since it will be forcing people to buy cars they don’t want. He says people want traditional gas-powered cars and the Biden administration is pushing electric cars down their throats.
Okay, let’s get back to Donald Trump’s bloodbath. The Chinese cars that Trump wants to keep out of the U.S. with really high taxes (tariffs) are electric.
Many are now as cheap or cheaper to buy than equivalent gas-powered vehicles and far cheaper to fuel and maintain over their lifespan. This is why Trump insists on high taxes to keep people from buying them.
So to recap, Ross Douthat is telling us that Biden is trying to shove electric cars down consumers’ throats that they don’t want, while also implicitly defending Donald Trump’s plans to impose high taxes so that consumers won’t buy Chinese electric cars that he apparently thinks they do want.
That sort of argument might make sense on the New York Times opinion page, but not in reality-land.
Read More Leer más Join the discussion Participa en la discusión
I have long been amazed at how major debates over various economic policy issues can have completely contradictory assumptions, and no one seems to notice. This was driven home to me by a New York Times column by Peter Coy (a very good columnist) where he addressed the issue of whether AI would take all our jobs.
This risk has been arousing some concern in social media and various publications. This is striking because the prospect of no jobs raises a set of concerns that is 100 percent in the opposite direction of the frequently expressed problem of budget deficits and debt, as well as the problem of an aging population.
To put the issue as simply as possible, the story of AI taking all the jobs is a story where we can produce too much. The idea is that people don’t have jobs because there is no demand for their labor, AI is doing all the work.
This is the exact opposite of the budget deficit problem or the aging problem. Both of these are stories of scarcity. The deficit story is that government spending, given current tax structures, is pushing the economy beyond its capacity to produce goods and services.
If we are not hitting the economy’s capacity then we can just print the money, no matter how large the deficit is. We only get inflation if we push the economy beyond its ability to produce goods and services.
It’s a similar picture with the aging population story. The argument here is that we have too few workers to support a growing population of retirees. We would need ever higher taxes on the working population if we are to provide retirees with food, housing, healthcare and other necessities.
It is possible to construct stories where AI will lead to massive overproduction and an enormous reduction in the demand for labor. It is also possible to construct stories where large budget deficits push the economy up against constraints, leading to inflation, or where the aging population requires much larger taxes on workers.
However, it is not possible to put both stories together. If we really have to worry about AI radically reducing the demand for labor, then we don’t have to worry about the size of our budget deficit or debt. We also don’t have to worry about the rising ratio of retirees to workers. AI will take care of that, providing the goods and services our elderly need.
As far as my own view, I lean towards the AI taking the jobs story, although perhaps my scenario would not be as dramatic as some have been suggesting. I’m sure AI will have a big productivity impact in many sectors, but it is not going to be instantaneous.
We will gradually see reduced demand for lawyers, accountants, engineers, and in hundreds of other occupations. This will translate into lower prices for many items, which means higher real wages for workers in sectors seeing fewer layoffs. That should mean increased demand, as these workers spend their pay, which will create new jobs.
Of course, there is no guarantee that the benefits of increased productivity will accrue to workers, although that has generally been the case in the past. (The wage stagnation since 1980 has largely been a story where the wages of workers at the middle and bottom of the distribution went to workers at the top end like CEOs and Wall Street types.) We need policies to ensure that the productivity gains from AI are widely shared.
Just to be clear on this point, the issue is not one of government “redistribution,” as it is often framed. Government rules, not the market, will determine how the bigger pie associated with AI gets cut. There is no natural market distribution.
Just to take the most obvious and important example, ownership of AI is bestowed by government-granted patent and copyright monopolies. These are government policies, not the market.
Without these monopolies, it is unlikely that any company and/or individuals would be in a position to hugely profit from AI. Imagine that all AI software was fully open and could be used by anyone at zero cost. Also, the software embedded in the servers that power AI was fully open, so that anyone with a factory could replicate the servers. In this case, AI would likely be very cheap for anyone who saw a use, which means its benefits should be quickly passed on in the form of lower prices.
The government can take steps to ensure that gains are broadly shared. A higher minimum wage to go along with higher productivity would be an obvious measure. (We used to raise the minimum wage in step with productivity, it would be over $24 an hour today if we had continued this practice.)
We can also reduce the standard workweek. Instead of having overtime pay kick in at 40 hours a week, we can set the cutoff at 36 hours or 32 hours, or even less, depending on how much AI is increasing productivity.
And we could use our AI productivity dividend to spend more in areas like health care and education, as well as cleaning up the environment. All of which will be possible without higher taxes due to the AI increasing our output.
Again, I don’t see us stumbling into a world of unbelievable plenty tomorrow, but I do think AI offers enormous potential for productivity gains that can be broadly shared with the right policies. There really is not a basis for fears that we won’t have any jobs, but the fact that the issue is even raised means that we likely don’t have to worry about budget deficits or not having enough workers due to an aging population.
Read More Leer más Join the discussion Participa en la discusión
The New York Times ran one of its obligatory pieces on the horror story created by the growing government debt. The immediate instigation was a new report from the Congressional Budget Office that the debt to GDP ratio will hit a record high in 2029.
The piece included a paragraph on the horrors of this situation.
“‘This is yet another reminder that politicians put political priorities ahead of the long-term health of the country,’ Maya MacGuineas, president of the Committee for a Responsible Federal Budget, said in a statement. ‘There is no way to look at these eye-popping numbers without realizing we need to make a change.’ “
One way to improve the situation for those concerned about debt to GDP ratios is to adopt the old practice of tax farming. This was a practice common, among other places, in pre-revolutionary France. The government would sell off the right to collect a specific tax, such as a tariff at a particular port.
Selling off the right to collect a tax is a way to reduce the debt. It is a terrible economic practice, since privately collected taxes are likely to create a large amount of economic distortion and reduce output, but it does lower the debt. We can certainly go this route if it will make the people concerned about the government debt happier.
As a practical matter, the government still does something very similar to tax farming. It gives out patent and copyright monopolies that allow companies to charge prices that are hugely higher than the free market price.
The government uses these monopolies to pay for a large amount of innovation and creative work. They result in much higher prices for the protected items. In effect, we are allowing the beneficiaries of patent and copyright monopolies to charge a tax, just like in the good old days of tax farming, except instead of selling the right to collect the tax we are using the right to collect the tax as a way to pay for services the government wants performed.
And the neat thing about paying for services by issuing these monopolies is that it is entirely off the books. No one keeps track of the value of these monopolies, not even the deficit scolds who are always yelling at us about the need to reduce the deficit and debt.
It’s also important to recognize that we are talking about big bucks here. In the case of drugs alone, it is likely that the annual payments, due to higher drug prices, cost us more than $500 billion (1.8 percent of GDP) this year. We will spend more than $600 billion for drugs that would almost certainly cost us less than $100 billion in a free market. Drugs that can sell for tens of thousands for a year’s dosage would typically sell for a few hundred dollars in a free market.
The extra $500 billion a year that we pay for drugs comes to over $4,000 a family. It’s almost 60 percent of what the federal government will pay out in interest this year. And no one even knows about it. And this is just for drugs.
We pay hundreds of billions extra every year for items like software, smartphones, computers, video games, medical equipment, pesticides and fertilizers, and many other types of products because of these government granted monopolies. The total annual take from these rents is almost certainly well over $1 trillion, a sum that would far exceed current interest payments on the debt.
The country would surely be better off if the federal government paid out less money in interest every year. Those interest payments allow the beneficiaries to consume more than would otherwise be the case, leaving us with fewer resources for other consumption and investment.
The same story applies to the patent rents paid to drug companies, computer and software makers and the others who receive them. However, for some reason, we literally never hear a word in the media about these massive payments.
If the concern is really the drag that interest payments will be on the economy in future years, and that our children will somehow be less wealthy as a result (anyone hear of climate change?), then it makes zero sense to harp on interest payments and ignore patent and copyright rents.
Of course, if someone has a political agenda to reduce Social Security, Medicare, and other social programs, then this narrow focus would make sense. If this just a conceptual problem, and the deficit hawks can’t understand how patent rents and interest payments are two sides of the same coin, then maybe we should just do some large-scale tax farming to reduce the debt, and everyone can be happy.
Read More Leer más Join the discussion Participa en la discusión
The New York Times opinion section seems determined to promote an alternative reality about the economy. Today it featured a column by Ashley Goodall, a former executive at Cisco Systems, telling us why mass layoffs in tech are bad.
While Goodall makes several good points about layoffs being both bad from the company’s long-term perspective, in addition to obviously being bad for workers losing their jobs, there is a fundamental problem with the story. Layoffs are actually down in the tech sector.
The Bureau of Labor Statistics does not have a category defined as “tech,” but the larger information category, which includes most of the areas that would be considered tech, shows that layoffs are rarer than in the past. The discharge rate averaged 1.1 percent in 2023. That compares to 1.4 percent in 2019 and 1.2 percent in the prior two years. We would have to go back to 2016 to see a lower discharge rate in the sector. (The rate fell to 0.6 percent in January, the most recent month for which we have data.)
It’s possible that if we looked to a more narrow sector that could be considered “true” tech we would find a higher layoff rate, but this would mean we are considering a small segment of the workforce. As it is, the 3.0 million people employed in the information sector account for less than 2.0 percent of the workforce or about 15 percent of the number of people working in restaurants. If we whittled this down further to find a sub-sector where layoffs have been soaring, but not enough to move the needle for the larger information category, we are talking about a small group of workers.
There may be a story of large layoffs at a small number of high-profile companies, like Meta, which is highlighted in the piece, but this is not a story that tells us much about the larger economy or the labor market. It is wrong to misrepresent the data this way.
Read More Leer más Join the discussion Participa en la discusión
There is an old saying that in Washington, no bad idea stays dead for long. The Patent Eligibility Restoration Act (PERA), proposed by Senators Thom Tillis (R-NC) and Chris Coons (D-DE) seems designed to prove that proposition.
The basic idea behind the act is to increase the types of things for which people and corporations can get government-granted patent monopolies. These could raise the price of a wide range of items from prescription drugs and medical procedures to computer software and smartphones. It is also likely to mean billions of dollars more being wasted every year in patent suits and related litigation.
Few people seem to recognize how important patent monopolies are in the distribution of income. We will pay more than $600 billion this year on drugs (almost $5,000 per family) that would likely sell for less than $100 billion in the absence of patent monopolies or related protections.
Drugs are almost invariable cheap to manufacture and distribute. They are expensive because the government has given a monopoly to the company that produces them and will arrest any competitors. When a drug is needed for someone’s health or even life, that means drug companies can charge tens or even hundreds of thousands of dollars.
When you hear of families struggling to raise $100,000 for their kid’s cancer treatment, that is not because the drugs are expensive. It’s because the government-granted monopoly allows a drug company to charge an outlandish price.
And drugs are just part of the story. Patent monopolies cause medical equipment, computer software, computers, and many other items to cost far more than they would in a free market. Taken together, patent monopolies and related protections almost certainly cost us over $1 trillion a year.
There are strong economic and moral arguments for making these monopolies shorter and weaker. Among other things, they encourage drug companies to lie about the safety and effectiveness of their drugs.
We could just pay for the research upfront – we already spend close to $60 billion a year on research through the National Institutes of Health and other government agencies – and let new drugs be sold as cheap generics. But the industry would kill to prevent this sort of outcome.
In any case, it is absurd to go in the opposite direction and look to have more areas with government-granted patent monopolies as PERA would do. Among other things, it would allow companies to claim patents on genes they identified. This would radically raise the cost of treatments and medical research.
It would also allow patents on a range of abstract scientific discoveries and innovations. This brings back memories of two famous patent cases from the 1990s. Apple sued Microsoft when it introduced Windows, claiming that the new menu-based system infringed on Apple’s operating system by having the same “touch and feel.” Thankfully, the courts sent Apple packing on this one.
There was a similar story when Amazon attempted to claim a patent on one-click shopping. Having your system save customers’ information might have seemed a rather obvious approach once we had Internet shopping, but Jeff Bezos thought everyone should have to pay him a fee for using this method. Again, the courts sent Bezos packing.
However, with PERA, Amazon may have had a case. After all, if they had raced to the patent office they might have had a valid patent.
This is the sort of nonsense that we can expect to see in large quantities if PERA becomes law. It is 180 degrees at odds from what we should be encouraging businesses to do. We want them to develop better ways to do things and produce better products, not more creative ways to game the patent system. PERA will be a great bonanza for patent lawyers, but really bad news for just about everyone else.
Read More Leer más Join the discussion Participa en la discusión
Okay, I’m not really defending private equity, but I do have to point out that Marc Hogan has badly misrepresented the problems in the music industry in his New York Times column this morning.
Hogan would have us believe that we have a thriving music industry that is being swallowed up by money-grubbing private equity companies that now lay claim to a large share of artists’ recordings. While private equity companies undoubtedly engage in many sleazy practices, the fact is that the industry is hardly thriving. Hogan gets the story completely wrong.
He tells readers:
“The music industry’s revenues recently hit a new high, with major labels raking in record earnings,”
The link is to an industry publication that reports revenue from recorded music for the first half of 2023 at a record $8.4 billion. That would translate to $16.8 billion on an annual basis. If we go back to 2000, before streaming or digital downloads were common, sales were $19.1 billion. In nominal dollars, the economy is more than two and half times as large today as in 2000.
This means that if recorded music was as large a share of the economy today, as at the start of the century, revenue would have to be almost $45 billion a year. Relative to the size of the economy, streaming revenue is just over one-third as large today as in 2000. (Some of the revenue in 2000 went to the manufacture and distribution of physical discs, but this would have been a small share of the total.) This loss of revenue is the core problem with the music industry, not the dealings of private equity companies.
As a practical matter, rapacious corporations or promoters ripping off musicians is not exactly a new story. It’s possible that it is worse today, but it is absurd to imagine a golden age where most musicians could count on being paid well for their work.
Hogan inadvertently gives away the story when he cites Spotify’s decision to stop sending out royalty checks for songs with fewer than 1,000 streams in a year. People who follow his link would find that 1000 streams would net a performer $3. Things would have to be pretty bad indeed if that is going to make a noticeable difference for “artists on the lower rungs.”
The real problem is that we need to find ways to get more money to musicians and songwriters. The current system is not working and that would be true even if private equity didn’t exist.
There are alternatives that can do the trick, such as individual tax credits to support creative work. I have suggested a similar route for reviving local journalism, another area where the NYT is badly out to lunch.
There is an old saying that intellectuals have a hard time dealing with new ideas. The New York Times opinion section seems determined to demonstrate its truth on a regular basis.
Read More Leer más Join the discussion Participa en la discusión
Yes, I am serious. That is the answer that the New York Times opinion page gave us this morning. The argument is that if students leaving school didn’t have so much debt, it would be easier for them to take relatively low-paying jobs in journalism.
This is incredibly annoying for two reasons. First, there are serious proposals for trying to save local (and national) news outlets. The New York Times has chosen not to give these options space on its opinion pages, although it has featured people whining about the decline of the industry. (Yes, I tried to get a piece in, as I’m sure have others.) The point is that if we want to have local journalism, we need to create a way to pay for it, getting lower cost labor is not the answer.
The other reason that this piece is painful is that the author is apparently ignorant of President Biden’s income-driven student debt repayment plan. Under this plan, most people with low wages would not be seriously burdened by student loan debt.
A person earning the $56,000 median pay for journalists noted in the article would be paying $193 a month under the plan, if they were single with no kids. If they had one kid, they would be paying $97 a month.
And, if they made less than this, as would be the case for half of journalists, they would be paying less. A single journalist with no kids earning $40,000 would be paying $60 a month. They would be paying zero if they had one kid and they earned this salary.
In short, with Biden’s student loan repayment plan, student debt should not be a major burden for people working at low-paying jobs in journalism. This means that free journalism school will be an incredibly trivial subsidy to the industry.
It also is striking that the New York Times cannot seem to find out about the Biden’s administration’s income-driven loan repayment plan. There seems to be little knowledge among the general public of this plan, including among millions who could benefit from it. Maybe if the media outlets like the New York Times had more competent editors and reporters there would be greater public awareness of this important program.
Read More Leer más Join the discussion Participa en la discusión
The Washington Post made some serious errors or omissions in its 11 charts that are supposed to tell us how Covid changed the economy.
Wages
Starting with its second chart, the article gives us an index of average weekly wages since 2019. The index shows a big jump in 2020, which then falls off in 2021 and 2022, before rising again in 2023.
It tells readers:
“Many Americans got large pay increases after the pandemic, when employers were having to one-up each other to find and keep workers. For a while, those wage gains were wiped out by decade-high inflation: Workers were getting larger paychecks, but it wasn’t enough to keep up with rising prices.”
That actually is not what its chart shows. The big rise in average weekly wages at the start of the pandemic was not the result of workers getting pay increases, it was the result of low-paid workers in sectors like hotels and restaurants losing their jobs.
The number of people employed in the low-paying leisure and hospitality sector fell by more than 8 million at the start of the pandemic. Even at the start of 2021 it was still down by over 4 million.
Laying off low-paid workers raises average wages in the same way that getting the short people to leave raises the average height of the people in the room. The Washington Post might try to tell us that the remaining people grew taller, but that is not what happened.
The other problem with this chart is that it is giving us weekly wages. The length of the average workweek jumped at the start of the pandemic as employers decided to work the workers they had longer hours rather than hire more workers. In January of 2021 the average workweek was 34.9 hours, compared to 34.4 hours in 2019 and 34.3 hours in February.
This increase in hours, by itself, would raise weekly pay by 2.0 percent. As hours returned to normal in 2022, this measure would misleadingly imply that wages were falling.
It is also worth noting that the fastest wage gains since the pandemic have been at the bottom end of the wage distribution and the Black/white wage gap has fallen to its lowest level on record.
Saving Rates
The third chart shows the saving rate since 2019. It shows a big spike at the start of the pandemic, as people stopped spending on things like restaurants and travel and they got pandemic checks from the government. It then falls sharply in 2022 and is lower in the most recent quarters than in 2019.
The piece tells readers:
“But as the world reopened — and people resumed spending on dining out, travel, concerts and other things that were previously off-limits — savings rates have leveled off. Americans are also increasingly dip into rainy-day funds to pay more for necessities, including groceries, housing, education and health care. In fact, Americans are now generally saving less of their incomes than they were before the pandemic.
This is an incomplete picture due to a somewhat technical issue. As I explained in a blogpost a few months ago, there is an unusually large gap between GDP as measured on the output side and GDP measured on the income side. In principle, these two numbers should be the same, but they never come out exactly equal.
In recent quarters, the gap has been 2.5 percent of GDP. This is extraordinarily large, but it also is unusual in that the output side is higher than the income side, the opposite of the standard pattern over the last quarter century.
It is standard for economists to assume that the true number for GDP is somewhere between the two measures. If we make that assumption about the data for 2023, it would imply that income is somewhat higher than the data now show and consumption somewhat lower.
In that story, as I showed in the blogpost, the saving rate for 2023 would be 6.8 percent of disposable income, roughly the same as the average for the three years before the pandemic. This would mean that people are not dipping into their rainy-day funds as the Post tells us. They are spending pretty much as they did before the pandemic.
Credit Card Debt
The next graph shows that credit card debt is rising again, after sinking in the pandemic. The piece tells readers:
“But now, debt loads are swinging higher again as families try to keep up with rising prices. Total household debt reached a record $17.5 trillion at the end of 2023, according to the Federal Reserve Bank of New York. And, in a worrisome sign for the economy, delinquency rates on mortgages, car loans and credit cards are all rising, too.”
There are several points worth noting here. Credit card debt is rising, but measured relative to income it is still below where it was before the pandemic. It was 6.7 percent of disposable income at the end of 2019, compared to 6.5 percent at the end of last year.
The second point is that a major reason for the recent surge in credit card debt is that people are no longer refinancing mortgages. There was a massive surge in mortgage refinancing with the low interest rates in 2020-2021.
Many of the people who refinanced took additional money out, taking advantage of the increased equity in their home. This channel of credit was cut off when mortgage rates jumped in 2022 and virtually ended mortgage refinancing. This means that to a large extent the surge in credit card borrowing is simply a shift from mortgage debt to credit card debt.
The point about total household debt hitting a record can be said in most months. Except in the period immediately following the collapse of the housing bubble, total debt is almost always rising.
And the rise in delinquencies simply reflects the fact that they had been at very low levels in 2021 and 2022. For the most part, delinquency rates are just getting back to their pre-pandemic levels, which were historically low.
Grocery Prices and Gas Prices
The next two charts show the patterns in grocery prices and gas prices since the pandemic. It would have been worth mentioning that every major economy in the world saw similar run-ups in prices in these two areas. In other words, there was nothing specific to U.S. policy that led to a surge in inflation here.
The Missing Charts
There are several areas where it would have been interesting to see charts which the Post did not include. It would have been useful to have a chart on job quitters, the number of people who voluntarily quit their jobs during the pandemic. In the tight labor markets of 2021 and 2022 the number of workers who left jobs they didn’t like soared to record levels, as shown below.
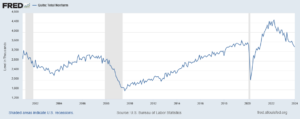
The vast majority of these workers took other jobs that they liked better. This likely explains another item that could appear as a graph, the record level of job satisfaction.
In a similar vein there has been an explosion in the number of people who work from home at least part-time. This has increased by more than 17 million during the pandemic. These workers are saving themselves thousands of dollars a year on commuting costs and related expenses, as well as hundreds of hours spent commuting.
Finally, there has been an explosion in the use of telemedicine since the pandemic. At the peak, nearly one in four visits with a health care professional was a remote consultation. This saved many people with serious health issues the time and inconvenience associated with a trip to a hospital or doctor’s office. The increased use of telemedicine is likely to be a lasting gain from the pandemic.
The World Has Changed
The pandemic will likely have a lasting impact on the economy and society. The Washington Post’s charts captured part of this story, but in some cases misrepresented events in important ways.
The Washington Post made some serious errors or omissions in its 11 charts that are supposed to tell us how Covid changed the economy.
Wages
Starting with its second chart, the article gives us an index of average weekly wages since 2019. The index shows a big jump in 2020, which then falls off in 2021 and 2022, before rising again in 2023.
It tells readers:
“Many Americans got large pay increases after the pandemic, when employers were having to one-up each other to find and keep workers. For a while, those wage gains were wiped out by decade-high inflation: Workers were getting larger paychecks, but it wasn’t enough to keep up with rising prices.”
That actually is not what its chart shows. The big rise in average weekly wages at the start of the pandemic was not the result of workers getting pay increases, it was the result of low-paid workers in sectors like hotels and restaurants losing their jobs.
The number of people employed in the low-paying leisure and hospitality sector fell by more than 8 million at the start of the pandemic. Even at the start of 2021 it was still down by over 4 million.
Laying off low-paid workers raises average wages in the same way that getting the short people to leave raises the average height of the people in the room. The Washington Post might try to tell us that the remaining people grew taller, but that is not what happened.
The other problem with this chart is that it is giving us weekly wages. The length of the average workweek jumped at the start of the pandemic as employers decided to work the workers they had longer hours rather than hire more workers. In January of 2021 the average workweek was 34.9 hours, compared to 34.4 hours in 2019 and 34.3 hours in February.
This increase in hours, by itself, would raise weekly pay by 2.0 percent. As hours returned to normal in 2022, this measure would misleadingly imply that wages were falling.
It is also worth noting that the fastest wage gains since the pandemic have been at the bottom end of the wage distribution and the Black/white wage gap has fallen to its lowest level on record.
Saving Rates
The third chart shows the saving rate since 2019. It shows a big spike at the start of the pandemic, as people stopped spending on things like restaurants and travel and they got pandemic checks from the government. It then falls sharply in 2022 and is lower in the most recent quarters than in 2019.
The piece tells readers:
“But as the world reopened — and people resumed spending on dining out, travel, concerts and other things that were previously off-limits — savings rates have leveled off. Americans are also increasingly dip into rainy-day funds to pay more for necessities, including groceries, housing, education and health care. In fact, Americans are now generally saving less of their incomes than they were before the pandemic.
This is an incomplete picture due to a somewhat technical issue. As I explained in a blogpost a few months ago, there is an unusually large gap between GDP as measured on the output side and GDP measured on the income side. In principle, these two numbers should be the same, but they never come out exactly equal.
In recent quarters, the gap has been 2.5 percent of GDP. This is extraordinarily large, but it also is unusual in that the output side is higher than the income side, the opposite of the standard pattern over the last quarter century.
It is standard for economists to assume that the true number for GDP is somewhere between the two measures. If we make that assumption about the data for 2023, it would imply that income is somewhat higher than the data now show and consumption somewhat lower.
In that story, as I showed in the blogpost, the saving rate for 2023 would be 6.8 percent of disposable income, roughly the same as the average for the three years before the pandemic. This would mean that people are not dipping into their rainy-day funds as the Post tells us. They are spending pretty much as they did before the pandemic.
Credit Card Debt
The next graph shows that credit card debt is rising again, after sinking in the pandemic. The piece tells readers:
“But now, debt loads are swinging higher again as families try to keep up with rising prices. Total household debt reached a record $17.5 trillion at the end of 2023, according to the Federal Reserve Bank of New York. And, in a worrisome sign for the economy, delinquency rates on mortgages, car loans and credit cards are all rising, too.”
There are several points worth noting here. Credit card debt is rising, but measured relative to income it is still below where it was before the pandemic. It was 6.7 percent of disposable income at the end of 2019, compared to 6.5 percent at the end of last year.
The second point is that a major reason for the recent surge in credit card debt is that people are no longer refinancing mortgages. There was a massive surge in mortgage refinancing with the low interest rates in 2020-2021.
Many of the people who refinanced took additional money out, taking advantage of the increased equity in their home. This channel of credit was cut off when mortgage rates jumped in 2022 and virtually ended mortgage refinancing. This means that to a large extent the surge in credit card borrowing is simply a shift from mortgage debt to credit card debt.
The point about total household debt hitting a record can be said in most months. Except in the period immediately following the collapse of the housing bubble, total debt is almost always rising.
And the rise in delinquencies simply reflects the fact that they had been at very low levels in 2021 and 2022. For the most part, delinquency rates are just getting back to their pre-pandemic levels, which were historically low.
Grocery Prices and Gas Prices
The next two charts show the patterns in grocery prices and gas prices since the pandemic. It would have been worth mentioning that every major economy in the world saw similar run-ups in prices in these two areas. In other words, there was nothing specific to U.S. policy that led to a surge in inflation here.
The Missing Charts
There are several areas where it would have been interesting to see charts which the Post did not include. It would have been useful to have a chart on job quitters, the number of people who voluntarily quit their jobs during the pandemic. In the tight labor markets of 2021 and 2022 the number of workers who left jobs they didn’t like soared to record levels, as shown below.
The vast majority of these workers took other jobs that they liked better. This likely explains another item that could appear as a graph, the record level of job satisfaction.
In a similar vein there has been an explosion in the number of people who work from home at least part-time. This has increased by more than 17 million during the pandemic. These workers are saving themselves thousands of dollars a year on commuting costs and related expenses, as well as hundreds of hours spent commuting.
Finally, there has been an explosion in the use of telemedicine since the pandemic. At the peak, nearly one in four visits with a health care professional was a remote consultation. This saved many people with serious health issues the time and inconvenience associated with a trip to a hospital or doctor’s office. The increased use of telemedicine is likely to be a lasting gain from the pandemic.
The World Has Changed
The pandemic will likely have a lasting impact on the economy and society. The Washington Post’s charts captured part of this story, but in some cases misrepresented events in important ways.
Read More Leer más Join the discussion Participa en la discusión
The media have run endless pieces about people being upset because prices are not falling back to their pre-pandemic level. They treat this as some great mystery that has people endlessly annoyed. The Wall Street Journal gave us the latest entry in this genre, a piece headlined, “we still don’t believe how much things cost.”
There actually is a very simple answer that is known to everyone who has ever sat in an intro econ class, wages have risen sharply over the last four years. The average hourly wage is up by just over 21.0 percent from its pre-pandemic level. That puts it slightly ahead of the 20.0 percent increase in the Consumer Price Index over this period.
That’s not a great story, but there have been many periods over the last half century when wages have trailed prices. And given that we faced a worldwide pandemic that led to a burst of inflation everywhere, it’s actually a damn good picture. Workers in most other countries have seen their wages fall behind prices.
But getting to the issue of why prices don’t fall, given that wages are 21 percent higher than they were four years ago, it would take some pretty fanciful reasoning to construct a story where prices fall back to their pre-pandemic level. Wages account for around 60 percent of costs. If wages are up 21 percent, it’s pretty hard to see how prices can get back to where they were four years ago.
Of course, the WSJ decided to emphasize its point by finding items that have seen exceptionally large price increases. That might help to push a “the economy is awful” story, but it is not a very useful way to inform readers about the economy.
Read More Leer más Join the discussion Participa en la discusión


