Article • Dean Baker’s Beat the Press
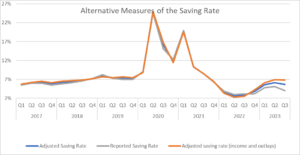
The reported saving rate has fallen sharply from its pandemic peaks, causing many commentators to speculate that people are running out of savings. At first glance, that is what the data show, with the saving rate for the most recent quarter coming in at 4.0 percent. That is up somewhat from the 3.3 percent rate of 2022, but down sharply from the double-digit rates of 2021, and well below the 7.0 percent plus rate we saw just before the pandemic. But there are some complicating factors that could change the picture.
National Income Versus Gross Domestic Product: The Mystery of the Statistical Discrepancy
In principle, we can measure gross domestic product on either the income side, adding up wages, rents, profits, and other forms of income or measure it on the output side, summing consumption, investment, government spending and net exports. We should get the same number either way, every dollar we spend buying things is income for someone.
As a practical matter, they never come out to be exactly the same, which is not surprising in a $27 trillion economy. The gap between the two is the statistical discrepancy. It usually is less than 1.0 percent of GDP in absolute value (it is positive if output exceeds income, negative when income is higher), but it can be larger, especially before the data are subject to comprehensive revisions over two or three years.
In recent quarters it has grown to be a large positive number, with measured output exceeding income by 2.5 percent of GDP ($688 billion). Most likely neither the income measure or output measure is exactly right, with the true number being somewhere in the middle. It is common to simply take the average of the two, with the idea that this is likely to be closer to the mark.
If we do this, we get that personal income is higher than the figure used to calculate the saving rate in the third quarter. (Saving is calculated as personal income, minus taxes and consumption.) I calculated an adjusted measure for personal income that assumes that the actual level of national income is equal to reported national income, plus half of the statistical discrepancy. (I adjusted for the small difference between personal income and national income by multiplying by the reported ratio for the two [NIPA Table 1.7.5, Line 25 divided by Line 16].)
I then calculated an adjusted saving rate, using this measure of adjusted personal income, instead of the reported measure of personal income. This came to 5.7 percent in the most recent quarter, as opposed to the 4.0 percent shown in the published data. This is shown in the figure below.
Source: Bureau of Economic Analysis and Author’s Calculations, see text.
However, if we think that the true measure of GDP lies halfway between the output side measure and the income side measure, then we should also adjust the output side of the calculation. This means that consumption will be somewhat lower than is reported. This will further increase the saving rate as shown in the adjusted saving rate line with both income and outlays adjusted.[1]
With this adjustment, the drop in the saving rate is largely eliminated. The saving rate in the third quarter, with both income and consumption adjusted, is 6.8 percent, higher than the averages for both 2017 and 2018. This implies that the widely touted drop in the saving rate in 2023 might just be a problem with measurement.
Taxes and Savings
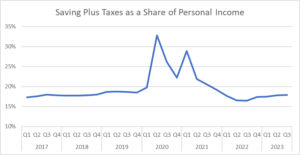
There is one other point worth making about the saving rate. Savings are measured as income minus taxes. Taxes jumped in 2022. This was not because of an increase in the tax rate, it was due to the fact that people were paying capital gains taxes on stocks that they sold. Since capital gains do not count as income, selling stock at a profit and paying taxes on the gains, means households have lower disposable income.
This means, for example, if a household paid $2,000 in taxes on $10,000 in gains, its disposable income would be $2,000 lower in the year it sold the stock than in the prior year, even if its other income was exactly the same.
We can adjust for the impact of tax payments by simply taking savings (adjusted savings here), plus taxes, as a share of adjusted personal income. This is shown in the figure below.
Source: Bureau of Economic Analysis and Author’s Calculations, see text.
As can be seen, there is a modest dip in this measure in the second half of 2022, but the most recent figure of 17.9 percent is above the 2017 and 2018 averages. By this measure also, it seems that the drop in the saving rate is just the result of measurement error.
[1] I multiplied reported outlays by 1 minus half the size of the statistical discrepancy (Table 2.1, Line 28 *(1-0.5*(Table 1.7.5 (Line 15/Line1).