Article • Dean Baker’s Beat the Press
I see that Peter Petri and Michael Plummer (PP) have responded to my blog post on their models projections for the TPP. In essence, they minimize the concern that the TPP or even trade deficits more generally can lead to a prolonged period of high unemployment or secular stagnation to use the currently fashionable term.
Dealing with the second issue first, they argue:
“While trade agreements include many provisions on exports and imports, they typically contain no provisions to affect savings behavior. Thus, net national savings, and hence trade balances, will remain at levels determined by other variables, and real exchange rates will adjust instead.
“A similar argument applies to overall employment. The TPP could affect employment in the short run — a possibility that we examine below — but those effects will fade because of market and policy adjustments. Since there is nothing in TPP provisions to affect long-term employment trends, employment too will converge to these levels, as long as adjustments are completed in the model’s 10 to 15 year time horizon.”
In short, PP explicitly argues that trade agreements neither affect the trade balance nor employment as a definitional matter. They argue that the trade balance is determined by net national savings. They explicitly disavow the contention in my prior note that we cannot assume an adjustment process that will restore the economy to full employment:
“In fact, critics of microeconomic analysis often challenge the credibility of market adjustment even in the long term. Dean Baker (2016) argues, for example, that mechanisms that may have once enabled the US economy to return to equilibrium are no longer working in the aftermath of the financial crisis. But the data tell a different, less pessimistic story (figure 1). Since 2010, the US economy has added 13 million jobs, a substantial gain compared to job growth episodes in recent decades, and the US civilian unemployment rate has declined from nearly 10 percent to under 5 percent. The broadest measure of unemployment (U6), which also includes part-time and discouraged workers, has declined almost as sharply, from 17 to 10 percent, and is now nearly back to average levels in precrisis, nonrecession years.”
As I noted in my original blog post, the PP analysis is entirely consistent with standard trade and macroeconomic approaches, however these approaches do not seem credible in the wake of the Great Recession. The standard view was that the economy would quickly bounce back to its pre-recession trend levels of output and employment. This view provides the basis for the projections made by the Congressional Budget Office (CBO) in its 2010 Budget and Economic Outlook (CBO, 2010). These projections are useful both because they were made with a full knowledge of the depth of the downturn (the recovery had begun in June of 2009) and also because CBO explicitly tries to make projections that are in line with the mainstream of the economics profession.
The figure below shows the projected path of GDP in billions of 2009 dollars from 2010 to 2016 compared with the actual path.
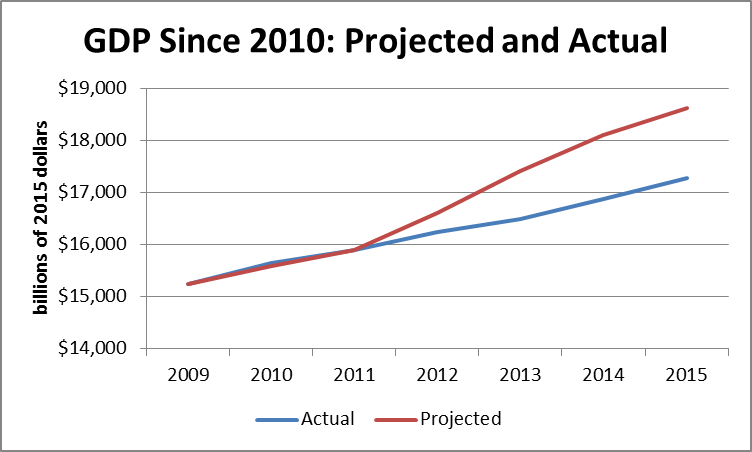
Source: CBO and BEA.
While PP implies that recovery has pretty much set everything back to normal, the data do not support this contention. Output in 2015 was $1,330 billion (in 2015 dollars) below the level that CBO had projected in 2010.[1] This is a loss in output of $4,180 per person. The cumulative gap between the path projected by CBO and the actual path of the economy was $3,810 billion or $11,940 per person.
The recovery in employment was also much slower than CBO had projected. Employment February of 2016 is almost 6 million below the level projected in 2010 by CBO.[2] The weakness of the labor market has also been associated with a large redistribution from labor to capital. CBO projected that the labor share of GDP would be 0.8 percentage points higher in 2015 than was in fact the case. The lost output combined with the redistribution from wages to profits implies a loss of wage income of $1040 billion in 2015 or an average of $7,460 per worker.
To put this loss in perspective, this loss of wage income would have the same impact on the aggregate take home pay of worker as an increase in the Social Security tax of 14.3 percentage points, which would more than double the current level. (Most of this loss is due to fewer people working, not lower wages.) Given the actual path of the recovery from the Great Recession, it defies reality to assert that we don’t have to worry about a trade deficit creating a gap in demand and higher unemployment. Can anyone doubt that if the annual trade deficit had been $300 billion lower (@ 2 percentage points of GDP) over the last six years that we would have seen far more employment and higher wages?
Before the Great Recession few mainstream economists took seriously the possibility that major economies could suffer from long periods of inadequate demand which depress employment. This is no longer true, as many of the world’s most prominent economists, including Paul Krugman, Larry Summers, and Olivier Blanchard, openly wrestle with the problem of secular stagnation. If economies can suffer from a chronic shortfall in demand then there is no mechanism to automatically replace the demand lost as a result of a larger trade deficit.
After dismissing the idea that trade in general can lead to lower levels of output and employment, PP argue that in any case the TPP is too small to have a noticeable impact on employment and wages. While noting the work of Autor, Dorn, and Hanson, which did find a substantial impact on employment and wages as a result of imports from China, PP argue that this impact was not due to trade per se, but rather a:
“massive surge in net capital inflows into the United States.”
This should not provide much basis for complacency about the impact of the TPP. A massive surge of net capital flows is by definition the flip side of a large rise in the trade deficit. One implies the other. Of course none of the standard trade models predicted the massive increase in the trade deficit that we saw in the decade following 1997.[3] They are not designed for that purpose. By design, the sort of model employed in the PP analysis can tell us nothing about whether we should anticipate a “surge” in capital inflows following the passage of the TPP. There are two reasons that we should be concerned about the impact of the TPP on the size of the trade deficit and therefore overall levels of employment.
First, the TPP limits the ability of the United States government to pressure countries over their currency policy. In principle, the U.S. government can use tariffs and other measures to retaliate in a situation where it has determined that a foreign government is deliberately depressing the value of its currency to gain a trade advantage. Its ability to apply such measures will be sharply curtailed by the rules in the TPP. This means that if one of the countries in the agreement chooses to hold down the value of its currency by buying massive amounts of dollars, the U.S. government will be less well positioned to pressure this country to change the policy.
The other reason that the TPP should raise these concerns is the failure to include rules on currency in the agreement itself. The TPP has been one of the biggest items on the Obama administration’s trade agenda in its two terms in the White House. If it chose not to address the problem of currency management in this agreement, it is difficult to see where it or a future administration will take up the issue. Access to the TPP was an important potential carrot to many of the parties.
For example, PP project that Vietnam will see a gain of 8.1 percentage points to its GDP in 2030 as a result of the deal. This could have been a very large carrot with which to persuade Vietnam and other countries to accept enforceable rules on currency management. By not including such rules in the TPP, the United States is losing an important opportunity to prevent the sort of surges in capital inflows that led to the explosion of the trade deficit in the decade from 1997 to 2007. This concern is amplified by the fact that the TPP is quite explicitly designed to be expandable so that it may include major countries like India and China at some future date. For this reason, the failure to include enforceable rules on currency may turn out to have large impacts on the trade deficit, employment, and wages.
There is one other point in the debate over the TPP that deserves emphasis. The model used by PP assumes that the TPP does not affect the overall trade balance, but it does change the composition of trade. While this may not prove accurate for reasons I noted, it is worth noting one of the implications of this assumption. The TPP is quite explicitly designed to increase the amount of money that U.S. pharmaceutical companies collect from other countries for their drug patents and forms of intellectual property. It also should increase the amount of money that Microsoft and other software companies collect for their copyrights, as well as the sums that Disney and the rest of the entertainment industry collect for their intellectual property.
Using the PP analysis, if these industries collect more money for their patents and copyrights, manufacturing and other sectors must collect less for their output. In other words, if the pharmaceutical, software, and entertainment industry see their foreign revenue rise by $40 billion as a result of the TPP, then our trade deficit in other sectors must increase by $40 billion.
This amounts to a redistribution of income from manufacturing and other sectors to the pharmaceutical industry, the software industry, and the entertainment industry. Given recent trends in inequality, this may not seem like an appropriate goal for public policy at the moment.
Note: Some of the numbers in this post were corrected from an earlier version.
[1] The projections are taken from the data for Table C-1.
[2] This calculation is based on the projection of potential labor force growth in CBO (2010 Table 2-2) and the projection that the unemployment rate would be 5.0 percent in 2016.
[3] The dollar soared in value following the East Asian financial crisis as developing countries began to accumulate foreign reserves on a massive basis. This meant that instead of capital flowing from rich countries to poor countries, as the textbook story predicts, large amounts of capital flowed from poor countries to rich countries (Baker and Walentin 2001). This surge in capital inflows led to an explosion in the size of the trade deficit from just over 1.0 percent of GDP in the mid-1990s to a peak of almost 6.0 percent of GDP in 2005.