

August 14, 2020


Over 20 million people lost jobs and wages during the initial months of the pandemic. In July 2020, the economy was still down nearly 13 million jobs from its February level. The CARES Act, which was signed into law on March 27, 2020, included a number of provisions designed to replace lost income and keep people in their homes. These federal measures, along with ones adopted in some states and cities, have undoubtedly helped millions of people stay in their homes during the pandemic. Yet, housing insecurity — as measured by missing or deferring rent or mortgage payments, or having little confidence in one’s ability to make rent or mortgage payments — was very high during the initial months of the pandemic.
A forthcoming CEPR report will document trends and disparities in housing insecurity before and during the pandemic. This preview reviews the main findings of the forthcoming report. The findings include:
- Nearly one-in-three renters experienced housing insecurity, on average, each week from late April 2020 through July 2020. Among homeowners, about one-in-six were housing insecure during this period.
- Hispanic and Black renters have seen particularly large increases in housing insecurity, with roughly 45 percent of renters in both groups reporting housing insecurity during the pandemic, an increase of about 13 percentage points for Hispanic renters and 8 percentage points for Black renters since 2019.
- Among households with children, racial and ethnic gaps in housing insecurity — between white and Black households and white and Hispanic households — narrowed between 2017 and 2019. But this progress has been lost. Roughly 44 to 45 percent of Hispanic and Black households with children were housing insecure each week between April and July 2020, and the racial and ethnic gaps in housing insecurity were wider than at any point in 2017 to 2019.
This preview also uses logistic models to examine the relative contribution of certain demographic characteristics and labor market factors in predicting housing hardship. Findings that use these models include:
- Renters who lost jobs or earnings were 2.7 times more likely to be housing insecure than their job-stable counterparts. Similarly, mortgage holders who lost jobs or earnings were three times as likely to experience housing insecurity as job-stable mortgage holders.
- Low-income households, people of color, and households with children generally all had higher odds of housing insecurity compared to their reference groups (respectively, households with income of $50,000–$99,999, white people, and households without children).
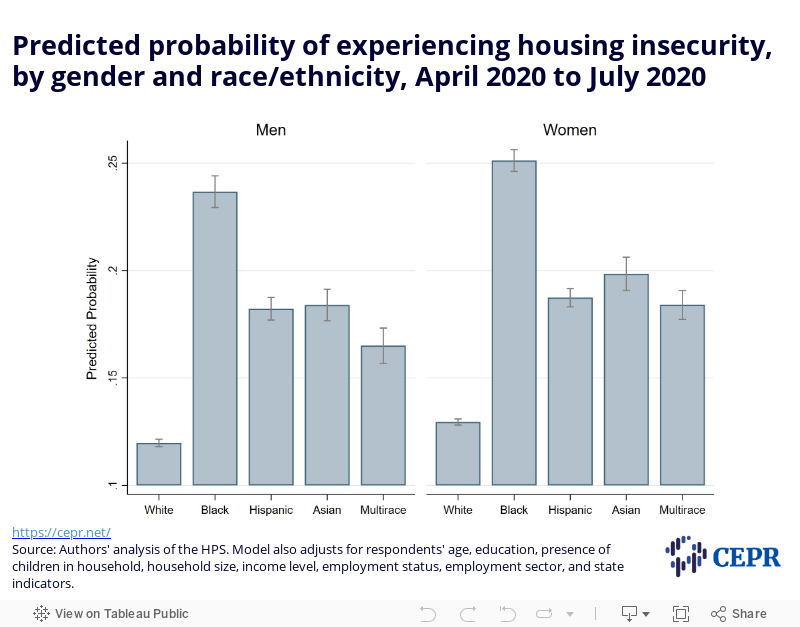
- Black women had the highest probability of housing insecurity, while white men had the lowest. Black men were just behind Black women in terms of risk. Next were Asian women, and then, all with roughly similar risks, were Hispanic women, Hispanic men, and Asian men.
Several of the CARES Act measures that were designed to replace lost income and keep people in their homes expired in late July, including a $600 per week increase in Unemployment Insurance and a federal moratorium on evictions in federally assisted housing. The HEROES Act, passed by the House of Representatives in May, would extend and expand the eviction moratorium, renew the UI benefit increase, and provide $200 billion in new funding for housing and homelessness programs. The Senate, however, has yet to pass similar legislation, and negotiations between Democrats and Republicans remain at an impasse. Absent a massive increase in direct financial assistance to struggling renters and homeowners, these findings suggest that millions of strapped renters and homeowners will go deeper into debt, face more hardship and insecurity, and ultimately lose or be evicted from their homes.
Housing Cost Burdens Before the Pandemic
According to the US Department of Housing and Urban Development (HUD), renters and homeowners are housing cost burdened if they spend more than 30 percent of household income on housing and utilities. Prior to the pandemic, approximately 20.8 million renter households — nearly 48 percent of all renter-occupied households — were housing cost burdened, including about 10.9 million who spend over half of their income on housing.
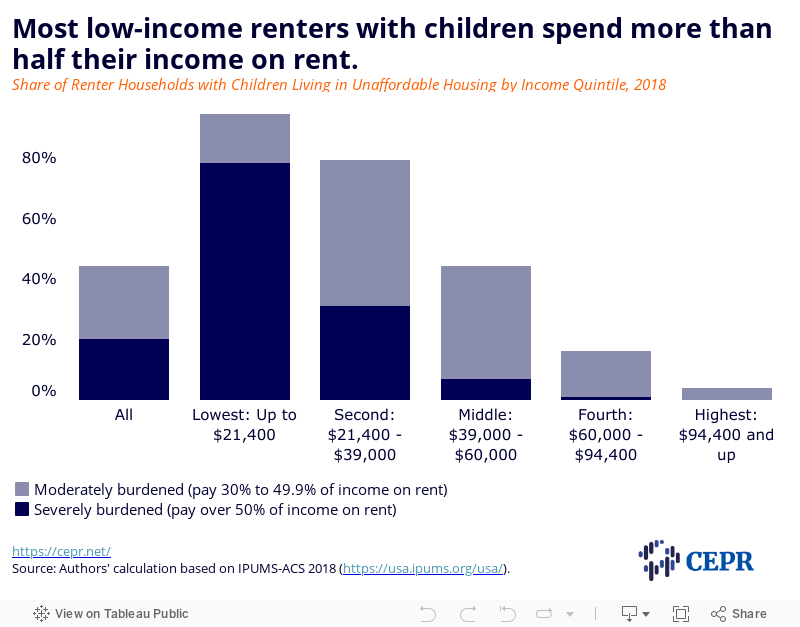
Low-income households with children are particularly likely to have heavy rent burdens. Figure 1 shows the percentage of households with children that are rent burdened in each income quintile. Over three-quarters of households in the first quintile (with pretax money income below $21,400) were severely housing cost burdened, meaning they spent more than half their monthly income on rent and utilities. Over 30 percent of households in the second quintile (income between $21,400 and $39,000) were severely housing cost burdened. By contrast, hardly any households with children in the 4th income quintile (with income between $60,000 and $94,400) were severely housing cost burdened.
Figure 1.
Housing Insecurity Trends Before and During the Pandemic
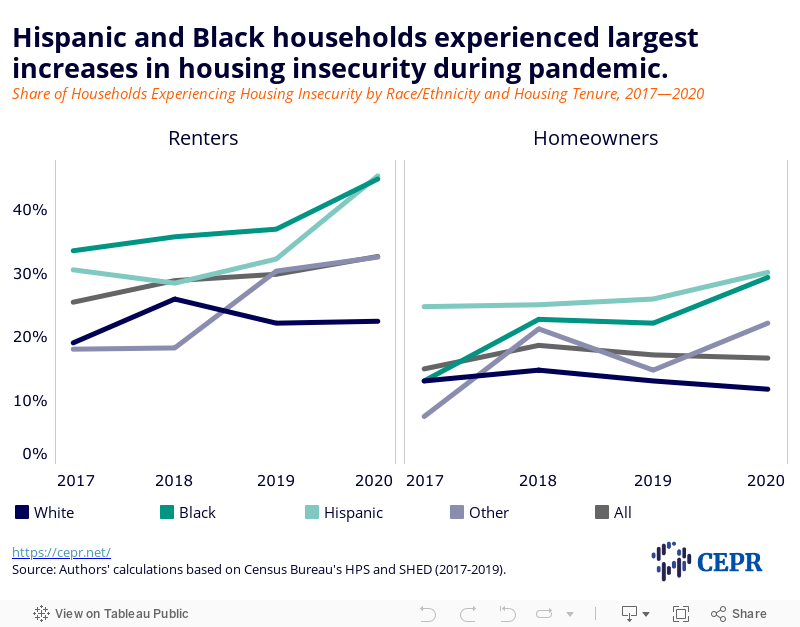
Figure 2 shows the percentage of households that have experienced housing insecurity — specifically, concern about being able to pay next month’s rent or mortgage — since 2017, by race and ethnicity. Figure 3 shows the share of households with one or more children that have experienced housing insecurity over the same time period. The 2020 data are from the Census Bureau’s Household Pulse Survey (HPS), a weekly experimental survey which began on April 23, 2020. The data for 2017 to 2019 are from the Federal Reserve’s Survey of Household Economics and Decisionmaking (SHED). The SHED question is similar to the HPS question, but with some wording differences. (see Methodology, below, for more details.)
As Figure 2 displays, on average, nearly one-in-three renters experienced housing insecurity each week from late April 2020 through July 2020. Among homeowners, about one-in-six were housing insecure, a figure roughly the same as in the 2019 SHED. The lack of an increase in housing insecurity among homeowners overall may be surprising, but is likely due to differences between renters and homeowners, including in demographic and job-related factors, and differences in the surveys.
As shown in Figure 2, there is a clear widening of housing insecurity by race and ethnicity among both renters and homeowners. In 2020, approximately 45 percent of Hispanic renters and 44 percent of Black renters were housing insecure, up by about 13 percentage points and 8 percentage points, respectively, since 2019. Among Hispanic homeowners, insecurity also increased between 2019 and 2020, but much more modestly.
Figure 2.
Housing Insecurity Among Households with Children
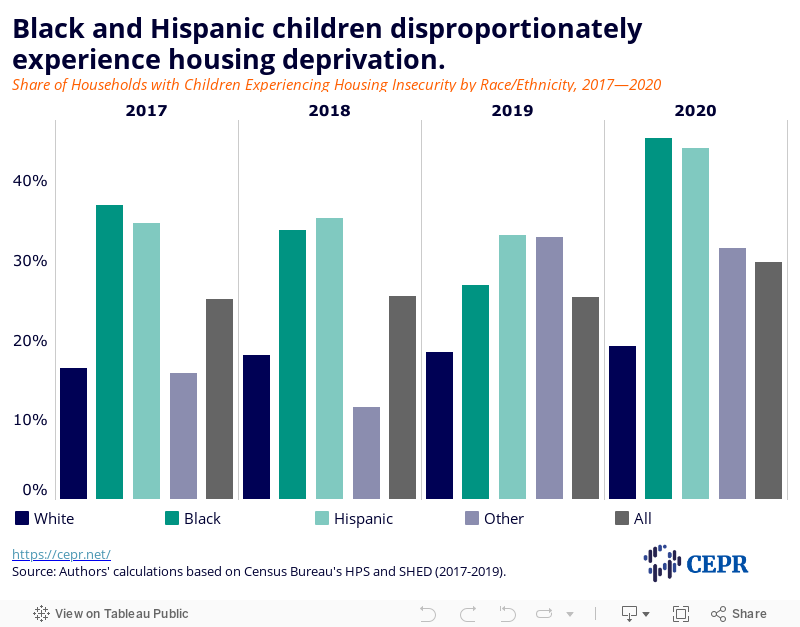
Figure 3 shows housing insecurity among households that include one or more children (in this figure, renters and owners are combined). In the three years before the pandemic, the housing insecurity gaps between white and Black and white and Hispanic households had been narrowing. But during the past several months this progress was lost and these gaps are now greater than in prior years with roughly 44 to 45 percent of Hispanic and Black households with children experiencing housing insecurity. Over the past three years, the housing insecurity gap between white and Black and white and Hispanic households with children has ranged from 15 to 20 percentage points; this has increased to 26 percentage points because of recent job losses. These figures do not directly measure eviction, foreclosure, or other involuntary housing transitions. But given that Black and Hispanic families generally have lower incomes and fewer assets to draw upon than white families, they are much more likely to face negative housing transitions in the coming months.
Figure 3.
Relationships Between Jobs and Earnings Losses, Household Characteristics, and Housing Insecurity During the Pandemic
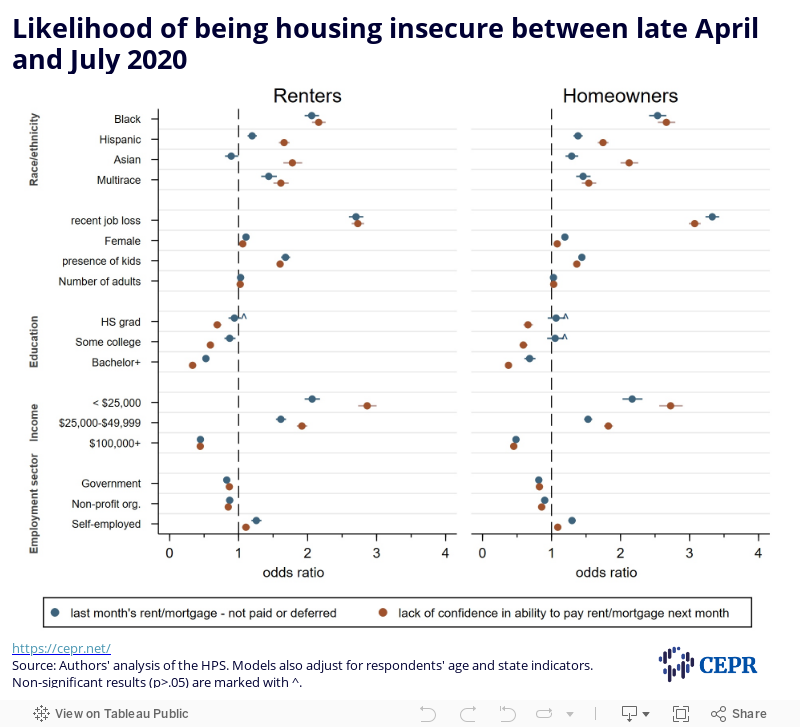
This preview uses logistic models to estimate the relationship between a households’ characteristics and two measures of housing insecurity in the past several months: (1) deferring or not paying last month’s rent or mortgage (past insecurity), and (2) having no or only slight confidence in paying next month’s rent or mortgage, including having already deferred, or planning to defer, the upcoming payment (future insecurity). An odds ratio greater than one suggests that the likelihood of the outcome was higher than in the reference group; values less than one indicate a lower likelihood of the outcome compared to the reference group.
As shown in Figure 4, households in which someone has lost a job or employment income since the beginning of the pandemic had considerably higher odds of housing insecurity than those without recent job or earnings losses. Renters who had lost jobs or earnings had 2.7 times higher odds of housing insecurity than their job-stable counterparts.
Similarly, low-income households, non-white people, and households with children generally all had higher odds of housing insecurity compared to their reference groups (respectively, households with incomes of $50,000–$99,999, white people, and households without children).
- When asked about their confidence in paying next month’s rent or mortgage, the odds of Hispanic households feeling less confident were about 70 percent higher than those of their white counterparts regardless of housing tenure. The odds for Black households were even higher, more than twice that of white renters who may struggle with rent payment.
- Renter households with children had significantly higher odds (68 percent) of falling behind on rent compared with childless households. Among owner-occupied households, having children increases the odds of housing hardship by about 40 percent.
- Unsurprisingly, the most financially disadvantaged households, regardless of housing tenure, exhibit exceptionally higher odds of falling behind on housing costs (about two times greater), or lacking confidence about upcoming payments (three times greater), than those with annual incomes between $50,000 and $99,999.
One striking finding shown in Figure 4 is that homeowners have not been immune to the pandemic’s adverse effects on housing security, despite the seemingly stable overall trend shown in Figure 2. Homeowners who have lost employment income since the beginning of the pandemic (or live with someone who has) are roughly three times as likely to report mortgage payment difficulties as homeowners who have not lost jobs. Similarly, the odds of lacking confidence about mortgage payments or deferring payments are approximately 2.6 times higher for Black homeowners compared to their white counterparts.
Figure 4.
Finally, this preview examines whether racial and ethnic differences in housing insecurity (pooling renters and homeowners) vary by respondent’s gender, while controlling for various other characteristics, including age, education, presence of children in the household, household size, income category, employment status, employment sector, and state of residence.
As Figure 5 shows, the largest differences in housing security are by the respondent’s race or ethnicity. But women are generally more vulnerable than men regardless of race and ethnicity. Hispanics are an exception, with both genders having about the same risk of housing insecurity. Black women have the highest probability of housing insecurity (0.25), while white men have the lowest, with the difference in risk being about 13 percentage points. Black men are just behind Black women in terms of risk. Next are Asian women (0.20), and then, all with roughly similar risks, are Asian men, Hispanic men and women.
Figure 5.
Discussion
As a result of the pandemic and the associated economic crisis, millions of renters and homeowners have fallen behind on their housing payments. Housing insecurity is much higher today, particularly among renters, than before the pandemic. Hispanic renters have seen the largest upward surge in housing insecurity since last year, followed by Black renters. The pandemic has erased the mildly declining patterns of housing deprivation among households with children over the past three years, and widened the disparities across racial and ethnic groups seen since 2017.
It is worth noting that due to differences between the SHED and the HPS surveys, as well as the experimental nature of the HPS, the trends documented in this preview may not fully reflect the exact magnitude of rising housing insecurity during the pandemic. A consistent survey that used the same methods and questions from 2017 through 2020 might show larger changes in housing insecurity between 2019 and April-July 2020, including for white renters and homeowners. However, the overall picture is clear: households that have lost jobs and employment income during the initial months of the pandemic are much more likely to be housing insecure than job-stable households, and racial and ethnic gaps in housing insecurity have widened.
Our analyses that adjust for a range of demographic and other factors further confirm this pattern. Recent household job or earnings losses are significantly associated with housing insecurity. Members of racial or ethnic groups are more likely to be housing insecure. This finding holds for both renters and homeowners. Among owner-occupied households, the odds of skipping last month’s or lacking confidence for next month’s housing payment for Black people is nearly twice that for Hispanics, when compared to their white counterparts. Measures that could prevent foreclosure for homeowners are as important as any rent relief that would help stabilize renters’ financial situations.
Combining data on renter- and owner-occupied households, we find that a typical Black household (irrespective of the respondent’s gender) has a much higher probability of experiencing housing insecurity, even after adjusting for other individual or household characteristics. As a result, the crisis is likely to increase the debt burdens on Black renters and homeowners, increase the number who are evicted or end up in foreclosure, and reduce the ability of Black renters to purchase homes. The combined result is likely to be a widening of the already well-documented racial wealth gap.
Rent and mortgage payments that are deferred or otherwise unpaid become debts that households remain liable for, even during periods covered by federal, state, or local moratoria on evictions and foreclosures. As households that missed or deferred payments gradually work to get back to their financial floor, they will be saddled with large debts. These will be particularly unmanageable for the millions of low-income households that were cost-burdened even in the best of recent times. This makes it particularly important for Congress and the President to quickly come to an agreement on pandemic relief legislation that includes a large increase in direct financial relief to low- and middle-income renters and homeowners who have deferred or otherwise missed past housing payments, and those who will be unable to make housing payments in the months ahead.
Methodology
The 2020 data on housing insecurity are from the Census Bureau’s Household Pulse Survey (HPS), a weekly experimental survey which began on April 23, 2020. Two survey questions in the Census HPS measure housing insecurity: (a) whether households paid or deferred last month’s housing payment, and (b) how confident respondents were that their household will be able to pay its next rent or mortgage payment on time. The listed answers for the second question were no/slight/moderate/high confidence and payment is/will be deferred. We categorize answers to the second question as a dichotomous variable and define households as lacking confidence about upcoming payments if they reported no or slight confidence or if they anticipated deferring, or had already deferred, next month’s payment. The data on housing insecurity in 2017 to 2019 are from the Federal Reserve’s Survey of Household Economics and Decisionmaking (SHED). The specific question asked in the 2019 SHED is: “Are you expecting to be unable to pay or only make a partial payment on each of the following bills this month?” with “rent or mortgage” being one of the listed bills.

