

August 16, 2016
August 16, 2016 (Prices Byte)
By Nick Buffie
Consumer inflation slows, though parents take a hit with schooling and childcare costs
Earlier this morning, the Bureau of Labor Statistics (BLS) released the newest data on the Consumer Price Index (CPI), the primary indicator of consumer inflation. After rising 0.2 percent in both May and June, prices actually fell ever so slightly in July. The degree of decrease (-0.04 percent) is equivalent to an annual rate of deflation of about 0.5 percent. This brings the year-over-year (July 2015 to July 2016) increase in prices to just 0.8 percent.
The trend looks a little better when we exclude volatile food and energy prices, which are bad predictors of future inflation. Core inflation was a bit less than 0.1 percent during the month, the equivalent of an annual inflation rate of 1.1 percent. This represents an overall slowing of price growth from May and June — when core inflation, like overall inflation, was 0.2 percent — and is less than the year-over-year core inflation rate of 2.2 percent. The discrepancy between the core inflation rate and the overall inflation rate is being driven primarily by energy prices, which are down 1.6 percent relative to June and a full 10.9 percent relative to July 2015. (Food prices are up 0.2 percent over the past year.)
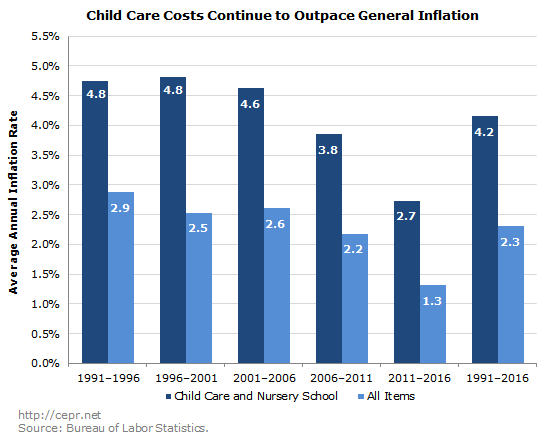
One of the more notable aspects of the latest data is the striking increase in childcare and nursery school prices. Childcare and nursery school costs have been outpacing general inflation for at least 25 years (the data do not go back any further than 1991); as CEPR documented yesterday, this is putting a significant strain on the budgets of low-income families. The figure below shows average annual rates of inflation using the five most recent five-year periods dating back to 1991. (Inflation is measured using the average price level from the first seven months of the year.) Over the past 25 years, childcare and nursery school costs have risen 177 percent, while prices more generally have risen just 77 percent.
Other costs for raising children have increased as well. For instance, elementary and high school tuition and fees have risen 3.2 percent over the past year (four times the overall inflation rate of 0.8 percent); college tuition and fees are up 2.7 percent.
Another noteworthy point from the most recent report is the divergence between inflation for goods and inflation for services. Over the past year, prices for services have risen 2.9 percent, while prices for goods have fallen 2.5 percent. Prices for durable goods fell 2.0 percent, while the prices for nondurables fell 2.6 percent. Even between June and July, inflation was -0.5 percent for goods, but was 0.2 percent for services.
The data from the CPI match the most recent figures from the Producer Price Index (PPI), an alternative measure of inflation that measures price increases as recorded by U.S. producers. The PPI is a somewhat more volatile measure of inflation than the CPI, though it shows the same differential between the rising costs of services and the falling prices of goods. According to the PPI, the prices for goods fell 0.4 percent last month and 2.3 percent over the past 12 months; by contrast, prices for services rose 1.0 percent over the past year.
The PPI shows a generally weak rate of inflation. Prices in the PPI are down 0.2 percent over the past year; core prices are up, but only by 0.4 percent. There also seems to be a deceleration in the rate of inflation, with core prices rising 0.3 percent in May but staying completely flat (0.0 percent inflation) in both June and July. Moreover, the prices for goods and services purchased by consumers are down more than the headline numbers suggest: if we exclude government purchases, inflation was -0.5 percent over the past month and -0.1 percent over the past year.
The International Price Program (IPP), a third index that measures the prices of traded goods, showed declining prices for both exports and imports. Export prices are down 3.0 percent over the past year, while import prices are down 3.7 percent. And while the declining costs of petroleum and fuel have played a large role in the latter drop, import prices have dropped even if we exclude those items.
One final noteworthy point relates to the different rates of inflation in different regions of the country. Last month, CEPR highlighted the fact that a number of regions in the country needed to be more worried about deflation than accelerating inflation. Year-over-year inflation has been a sturdy 1.4 percent in the West, but is running at just 0.8 percent in the Northeast, 0.7 percent in the South, and, most worryingly, only 0.4 percent in the Midwest. Moreover, two major Midwestern cities are already experiencing deflation: prices fell 0.1 percent in Chicago over the past year and dropped a full 0.6 percent in Cleveland. A low national inflation rate implies that at least some parts of the country will be experiencing deflation at any given moment — therefore, a boost to the national inflation rate is necessary if the Midwest is to avoid deflation.

