Report
Chronic Condition: Working Without Health Insurance

Report
The Affordable Care Act (ACA) of 2010 helped to reduce the share of the US population without health insurance by roughly half between 2009 and 2023. In 2009, immediately before the passage of the ACA, 16.7 percent of the population lacked health insurance, a figure that fell to 9.1 percent by 2015, the first year after full implementation, and stands at 8.0 percent in the most recent data available.
But even after the full implementation of the ACA, more than 27 million US residents still remain without health insurance.1 As we document here, almost 16 million of the uninsured are workers in full-time jobs, part-time jobs, or unemployed and actively seeking work. Over 10 million of these uninsured workers hold year-round, full-time jobs.
Workers between the ages of 18 and 64 have long been less likely than the average US resident to have health insurance (see Figure 1). Many workers fall through the holes in the patchwork of health insurance coverage, which includes employer-provided plans, individually purchased coverage through state-level health exchanges, and Medicaid (which is especially important for low-income workers). The vast majority of workers are ineligible for key government health insurance programs that provide higher rates of coverage for other populations. Workers under the age of 65, for example, are not eligible for the Medicare program, which provides nearly universal coverage for the US population 65 and older. Workers are also generally too old to qualify for the Children’s Health Insurance Program (CHIP), which, together with Medicaid, produces uninsured rates for children that are about half those of adult workers.2 Finally, a sizable share of the workforce lives in households with incomes that push them above the thresholds where they would qualify for Medicaid and other forms of need-based coverage.
This report uses annual Census Bureau survey data covering the years 2018 through 2023 to estimate the size and characteristics of the large share of the labor force that is currently working without the safety net that health insurance provides. The figures we present use the same strict definition of “uninsured” that the Census Bureau reports. By the Census definition, a person is uninsured if they were without health insurance for all 12 months of the year. In the data we present here, a worker who had coverage for even one month in the year does not count as uninsured.
As the data show, some groups of workers are much more likely than others to be uninsured. Workers who experience any spell of unemployment during the course of a year are the most likely to be without insurance (18.7 percent), followed by part-time or part-year workers (14.4 percent). But even a large share of full-time, full-year workers (10.5 percent) go without any health insurance coverage from any source during the course of the year.
In the rest of this report, we summarize key provisions of the ACA that affect workers’ access to health insurance, and describe the main features of the data and definitions we use. Next, we present our estimates of the uninsured rates for all workers by their employment status: full-time full-year workers; part-time or part-year workers; and workers that experienced any spell of unemployment during the year. For each of these three groups, we look separately at uninsured rates by a range of demographic characteristics, including gender, race and ethnicity, age, marital status, education level, and nativity and citizenship.3
Figure 1
Several features of the ACA were particularly relevant for workers between the ages of 18 and 64.4
Immediately after passage, the age that children could retain coverage through their parents’ policies increased from 19 to 26. This provision allowed younger workers to keep coverage through their parents while they generally held entry-level jobs that may not have offered health insurance or offered coverage only at a high cost to employees.
Early on, the ACA required large employers to offer health insurance to their employees and provided tax incentives for smaller employers to do the same.
Over the ACA’s first three years, newly created health insurance marketplaces made coverage available to adults who did not have access through an employer-sponsored plan. The ACA also provided substantial tax subsidies to low- and middle-income workers taking advantage of plans purchased through the exchanges.
The ACA also prohibited insurers from denying coverage or raising premiums based on an individual’s preexisting health conditions. This removed a barrier that previously made insurance either impossible or too costly for many workers.
One of the most important aspects of the ACA was its provision that allowed states to raise the upper income limit for eligibility for state Medicaid programs to 138 percent of the federal poverty line. Not all states have taken advantage of this change, but as of this writing, 40 states have done so, substantially increasing health insurance coverage in those states.5,6
Separately, the ACA substantially Improved the quality of health insurance by mandating certain types of preventive care coverage without a deductible or co-pay, reducing a widespread problem of “underinsurance.”7
We use nationally representative data from Annual Social and Economic Supplement (ASEC), which is conducted annually by the Census Bureau as part of the monthly Current Population Survey (CPS).8 The ASEC collects information from approximately 60,000 households on demographics, incomes, work status, and other characteristics, including detailed information on health insurance coverage. While the data are gathered primarily in March, most of the supplement’s questions focus on the household’s experience in the preceding calendar year. We focus here on the workers’ demographics, work status, and health insurance coverage throughout the calendar year preceding their March interview. A household’s answers provided in March of 2024 (currently, the most recent survey), for example, refer to their employment situation and health insurance coverage throughout 2023.
The ASEC offers several methods to measure an individual’s health insurance coverage in the calendar year before their interview. Throughout this report, we follow the Census Bureau practice of referring to individuals as “uninsured” if they “did not have health insurance coverage for the entire calendar year” prior to their March interview.9 This produces a conservative estimate of the number of workers without health insurance because it excludes workers who had health insurance at some point in the year, but lacked coverage in one or more months of the year.
We limit our sample to workers between the ages of 18 and 64. Workers 65 and older are overwhelmingly eligible for the federal Medicare program, which provides nearly universal coverage to the elderly, regardless of their income or employment status. Workers under 18 make up only a small portion of the workforce and their health insurance coverage generally comes through their parents (many of whom are in the workforce).10 Our main interest here is to document the size of the health insurance coverage gap experienced by workers and to explore how this gap varies by workers’ demographic characteristics and work situation.
With respect to demographics, the ASEC data allow us to identify workers by age, gender, race/ethnicity, marital status, presence or absence of a child in the household, and education level. The ASEC assigns two gender categories, male and female. We use detailed ASEC responses to define five mutually exclusive race/ethnicity categories: White, Black, Hispanic, Asian, and Other, where the Other category includes racial and ethnic groups with only small numbers of observations, even in the pooled multi-year data we use here. For simplicity, we limit marital status to two categories: currently married and not currently married (which includes single, divorced, and widowed). We distinguish between five mutually exclusive levels of formal education: less than high school, high school degree, some college but not a four-year degree, college graduate, and advanced degree.
To capture differences in employment status, we divide workers into three mutually exclusive categories that together cover all working-age adults who participated in work at some point in the calendar year: full-time, full-year workers; part-time or part-year workers; and workers who experienced at least one spell of unemployment of at least one week in duration. Full-time, full-year workers were employed in a job or jobs for at least 50 weeks in the year for at least 35 hours per week. Part-time or part-year workers were employed between one and 49 weeks in the year, or for fewer than 35 hours per week, or both. Our “unemployed” category includes survey respondents who had at least one spell of unemployment during the year, regardless of their full-time or part-time status when not unemployed.
We also divide workers into five pay bands by first ordering all workers from the lowest to the highest hourly rates of pay, and then dividing them into five equally sized groups.11 We define these wage quintiles across the entire wage distribution, grouping men and women together. This means that the wage quintiles we show below generally contain different numbers of men and women in each quintile. Importantly, women are overrepresented in lower quintiles and men are overrepresented in higher quintiles.
Our goal is to document both the size of the health insurance coverage gap for workers and to illustrate how those gaps vary by a worker’s employment status and demographics. In order to increase the precision of the analysis for smaller demographic groups, we have pooled together the last six years of ASEC data. These surveys were fielded every March from 2019 through 2024, and refer to calendar years 2018 through 2023. Each year’s data are weighted to be representative of the population within the year and over time. We include the March 2020 CPS, which was fielded just as the COVID-19 pandemic was declared. Excluding the March 2020 survey does not meaningfully alter any of our qualitative or quantitative findings.12
Tables 1 through 4 show the results of applying this framework to the last six years of ASEC data. These tables report the uninsured rate across the range of demographic groups and labor market states as defined in the preceding section.
The top line of Table 1 shows the uninsured rate for all workers and, separately, for full-time full-year, part-time or part-year, and unemployed workers. Over the last six years, on average, 10.5 percent of workers were uninsured, meaning that they were without health insurance for the entire calendar year prior to their interview. Workers who experienced at least one spell of unemployment during the year had the highest uninsured rate (18.7 percent). The uninsured rate for part-time or part-year workers was almost as high (14.4 percent). But even full-time, full-year workers were at substantial risk of being uninsured (8.8 percent).
The remaining rows of Table 1 detail differences in uninsured rates by race and ethnicity, gender, age, marital status, and the presence of children in the respondent’s household. For ease of exposition, we focus here and later on the results for full-time, full-year workers. This group is the largest of the three types of workers analyzed, and is consistently the group that is least likely to be uninsured across the three employment types we analyze.
The share of uninsured workers varies strongly by race and ethnicity. Among full-time, full-year workers, Hispanic workers (21.1 percent) are most likely to be uninsured. Their rate is about four times higher than the corresponding rate for Asian workers (5.1 percent) and white workers (5.5 percent).13 After Hispanic workers, Black workers (9.1 percent) have uninsured rate that are almost double the rates for Asian and white workers.
Over the last six years, on average, 10.4 percent of men who worked full-time and full-year were uninsured, compared with 6.8 percent of women in full-time, full-year employment.
The patterns of uninsured rates by race and ethnicity for men and women separately mirror the patterns for the two groups combined. For each racial and ethnic group, men consistently have higher uninsured rates than women;14 and, for both genders, white and Asian workers have the lowest uninsured rates, followed by Black workers, with Hispanic workers experiencing a substantially higher likelihood of being uninsured.
Uninsured rates also differ substantially by age group. Rates are highest for 18-to-25 year-olds (14.0 percent for full-time, full-year workers). This group includes 19-to-25 year olds who, in principle, became eligible under the ACA for continued coverage on parental insurance plans.15 The 51-to-64 year-old age group was the least likely to be uninsured (6.2 percent), while 26-to-50 year-olds fell in between (9.0 percent).
Unmarried workers are far less likely than married workers are to have health insurance. About 12.6 percent of unmarried full-time workers are insured, more than double the corresponding 6.0 percent rate for married workers. This disparity may be related in part to the opportunity that married workers have to be covered through their spouse’s health insurance plan.
Full-time workers who live in a household without children are also more likely to be uninsured (9.9 percent) than full-time workers who live in a household where a child is present (7.6 percent). This difference may reflect the greater likelihood that households with children are eligible for Medicaid, because Medicaid eligibility is determined in part by income relative to household size.
Table 1
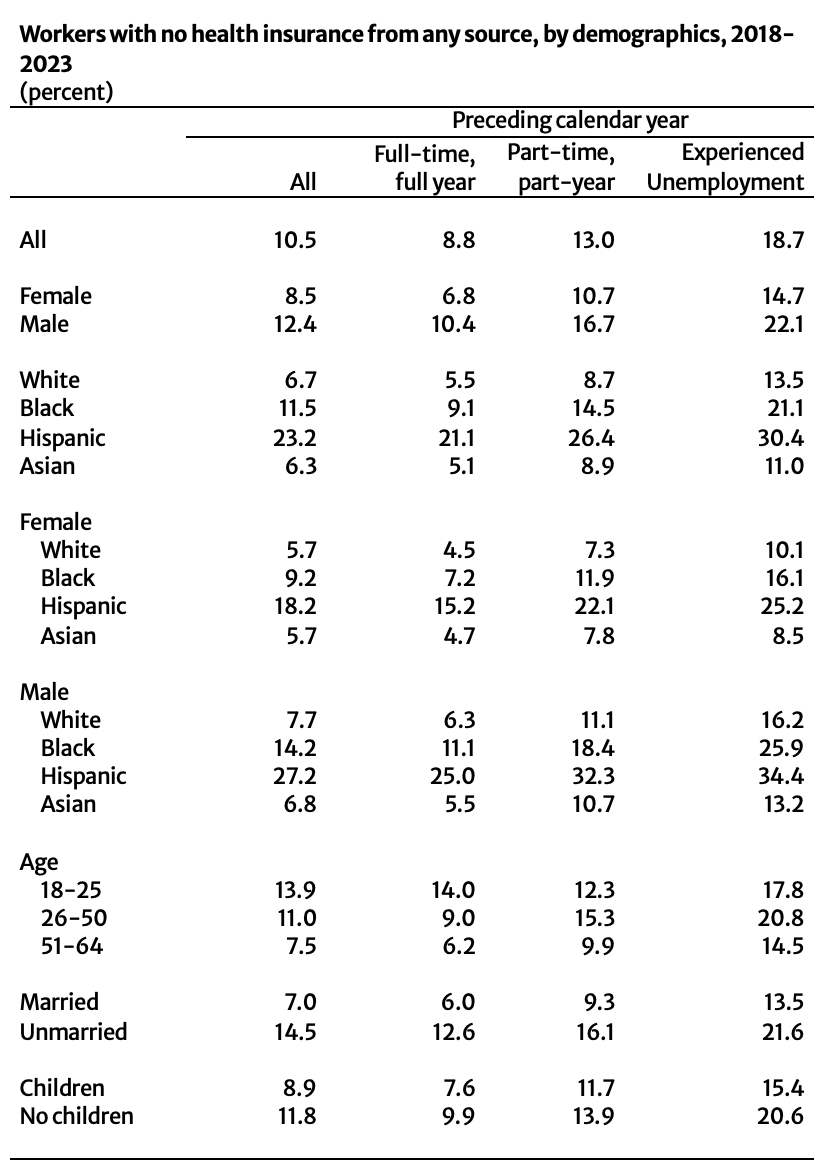
Notes: Those without health insurance reported having no health insurance from any source during the entire calendar year. Unemployed group composed of those who experienced any spell of unemployment during the calendar year, regardless of full-time or full-year status when employed. Racial and ethnic groups are mutually exclusive. Children indicates that the respondent’s household included at least one child.
Source: Authors’ analysis of the IPUMS extract of the Current Population Survey’s Annual Social and Economic supplement, 2019-2024.
Table 2 summarizes differences in the uninsured rate by workers’ educational attainment. Across all worker types, uninsured rates vary inversely – and strongly – with educational attainment. For full-time, full-year workers, the uninsured rate for a worker with less than a high school degree (32.3 percent) is almost 15 times higher than the rate for a worker with an advanced degree (2.2 percent). Workers with a high school degree but no additional education are six times more likely to lack insurance (13.9 percent) than a worker with an advanced degree. Workers with some college but no degree are almost twice as likely to be uninsured (8.0 percent) than those who finish college (4.0 percent).
The same inverse relationship between formal education and being uninsured holds when workers are disaggregated by gender. As is the case for the entire working population, at every education level men are more likely than women to be uninsured.
Table 2
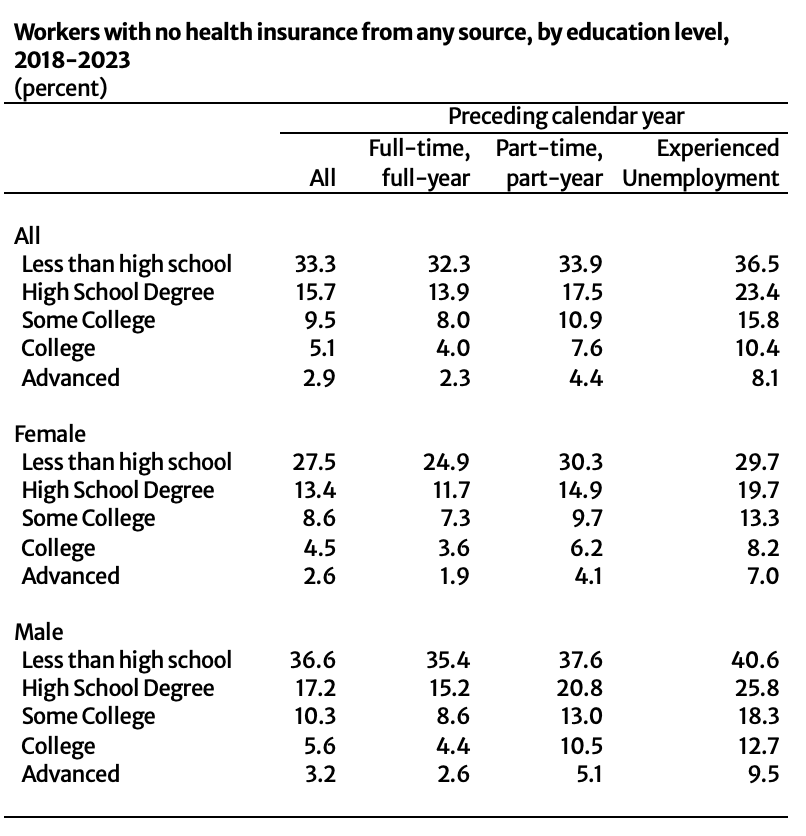
Notes: Those without health insurance reported having no health insurance from any source during the entire calendar year. Unemployed group composed of those who experienced any spell of unemployment during the calendar year, regardless of full-time or full-year status when employed.
Source: Authors’ analysis of the IPUMS extract of the Current Population Survey’s Annual Social and Economic supplement, 2019-2024.
Table 3 presents results by workers’ wage level, defined here by wage quintile. Uninsured rates are, by far, highest for workers in the lowest fifth of the wage distribution. More than one in five (21.4 percent) full-time, full-year workers in the bottom of the wage distribution lacks health insurance, compared with less than one in 50 (1.7 percent) for workers at the top.
As with earlier tables, disaggregation by gender does not alter the relationship seen in the aggregated data. Men at every wage quintile are more likely to be uninsured than women in the same quintile.
Table 3
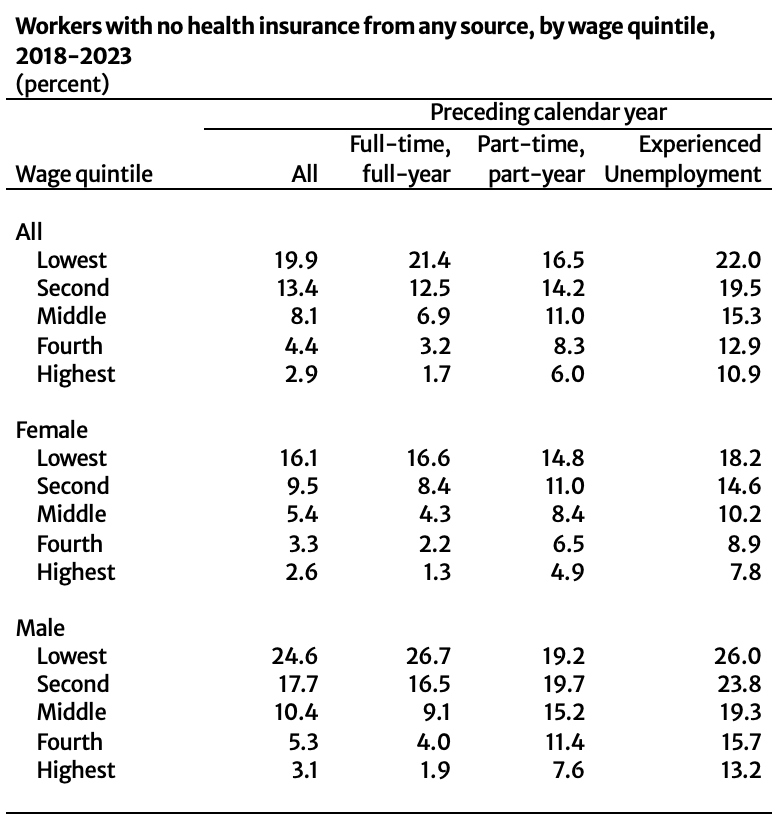
Notes: Those without health insurance reported having no health insurance from any source during the entire calendar year. Unemployed group composed of those who experienced any spell of unemployment during the calendar year, regardless of full-time or full-year status when employed. Wage quintiles are based on average hourly earnings during weeks and hours worked; some unemployed workers who did not report earnings excluded from analysis.
Source: Authors’ analysis of the IPUMS extract of the Current Population Survey’s Annual Social and Economic supplement, 2019-2024.
Table 4 highlights the importance that citizenship status plays in obtaining health insurance. Full-time, full-year workers who were born outside the United States and are not US citizens are far more likely to be uninsured (28.9 percent) than workers who are US citizens – both those born in the United States (6.7 percent) and those born abroad (8.6 percent).
Lack of coverage is particularly acute for part-time or part-year and unemployed non-citizen workers: 36.0 percent of part-time workers and 39.0 percent of unemployed workers are uninsured. These rates are up to three times higher than the corresponding rates for US citizens with the same employment status.16
Table 4
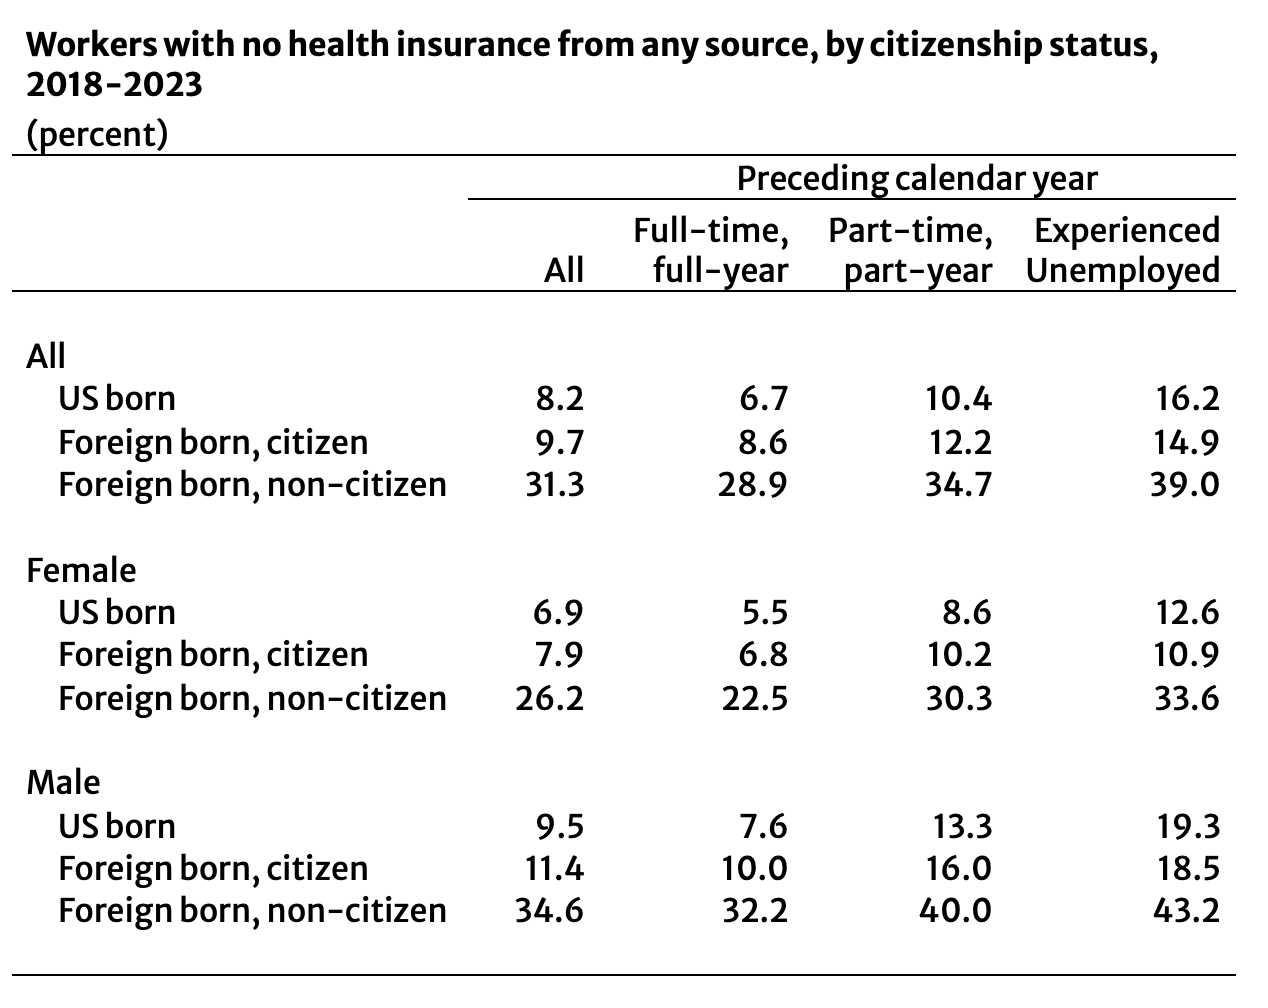
Notes: Those without health insurance reported having no health insurance from any source during the entire calendar year. Unemployed group composed of those who experienced any spell of unemployment during the calendar year, regardless of full-time or full-year status when employed.
Source: Authors’ analysis of the IPUMS extract of the Current Population Survey’s Annual Social and Economic supplement, 2019-2024.
The results we’ve presented so far show average uninsured rates for all members of the specific population being considered. But the members of each narrowly defined group may also differ systematically in other ways that affect the likelihood of being uninsured. For example, Hispanic workers are much more likely to be uninsured, but they are also on average younger than other workers, and we know from separate analysis that younger workers are less likely to have insurance, even within each racial and ethnic group. We also know that Hispanic workers are more likely than other workers to be immigrants, a group that is much less likely to have health insurance than US-born workers.
To address this issue, Table 5 presents results from a series of regressions that seek to control for internal differences in the composition of the groups analyzed in the earlier set of tables. These regression results are based on linear probability models where the dependent variable is a binary variable indicating whether a worker is uninsured or not. The regressors are binary variables defined exactly as in the preceding tables, with the addition of a set of controls for the health insurance coverage year (2019 through 2023, with 2018 as the excluded category). The first two columns analyze results for all workers: in column one, we do not distinguish between employment status; in column two, we control for work status by including binary variables for whether a worker was in part-time, part-year employment or experienced a spell of unemployment during the year. The remaining columns look separately at workers by their employment status.
The controls for the year covered in each survey show only small, frequently statistically insignificant differences across years in the probability of being uninsured. This holds true for the survey administered in March 2020, which was affected by the onset of the COVID-19 epidemic, and is captured in the row marked 2019 (the calendar year covered by the March 2020 survey). While not conclusive, these results are consistent with the view that challenges with fielding the March 2020 survey did not systematically alter estimates of the probabilities of being uninsured relative to other years.
In general, the results using regression controls show the same relative patterns across demographic groups that we saw in the earlier tables without controls.
The main difference between the regression-controlled estimates and the estimates without controls is that the regression-controlled estimates are smaller in size. These smaller effects suggest that groups in the population with higher “raw” rates of being uninsured generally also have other characteristics that tend to increase their probabilities of being uninsured. In the case of full-time, full-year Hispanic workers, for example, their uninsured rate in Table 1 without any controls was 21.1 percent – 15.6 percentage points higher than the 5.5 percent rate for white workers in the same table. After controlling for age, gender, education, citizenship, and other factors, however, the difference between the two groups falls to 4.7 percentage points in Table 4. This decline in probabilities reflects multiple differences between the Hispanic and white workforces. Relative to white workers, Hispanic workers are on average younger, more likely to be male, more likely to have less than a high school degree, and less likely to be a US citizen – all factors that are associated with a higher probability of being uninsured, independent of a worker’s race or ethnicity.
Our primary interest is in identifying and quantifying the size of groups in the workforce that are most disadvantaged by our current healthcare system. The unadjusted rates in Tables 1 to 4 tell us directly which communities and which kinds of individuals currently lack coverage. The regression-controlled estimates of the implied relative probabilities of being uninsured in Table 5 do not change the earlier estimates of either the percentage or the total number of workers in each demographic group who lack health insurance. The regression results, however, can help us to understand some of the underlying factors that make particular communities and individuals more or less vulnerable, and thereby assist in the process of identifying strategies for how to improve the coverage rates.
Table 5
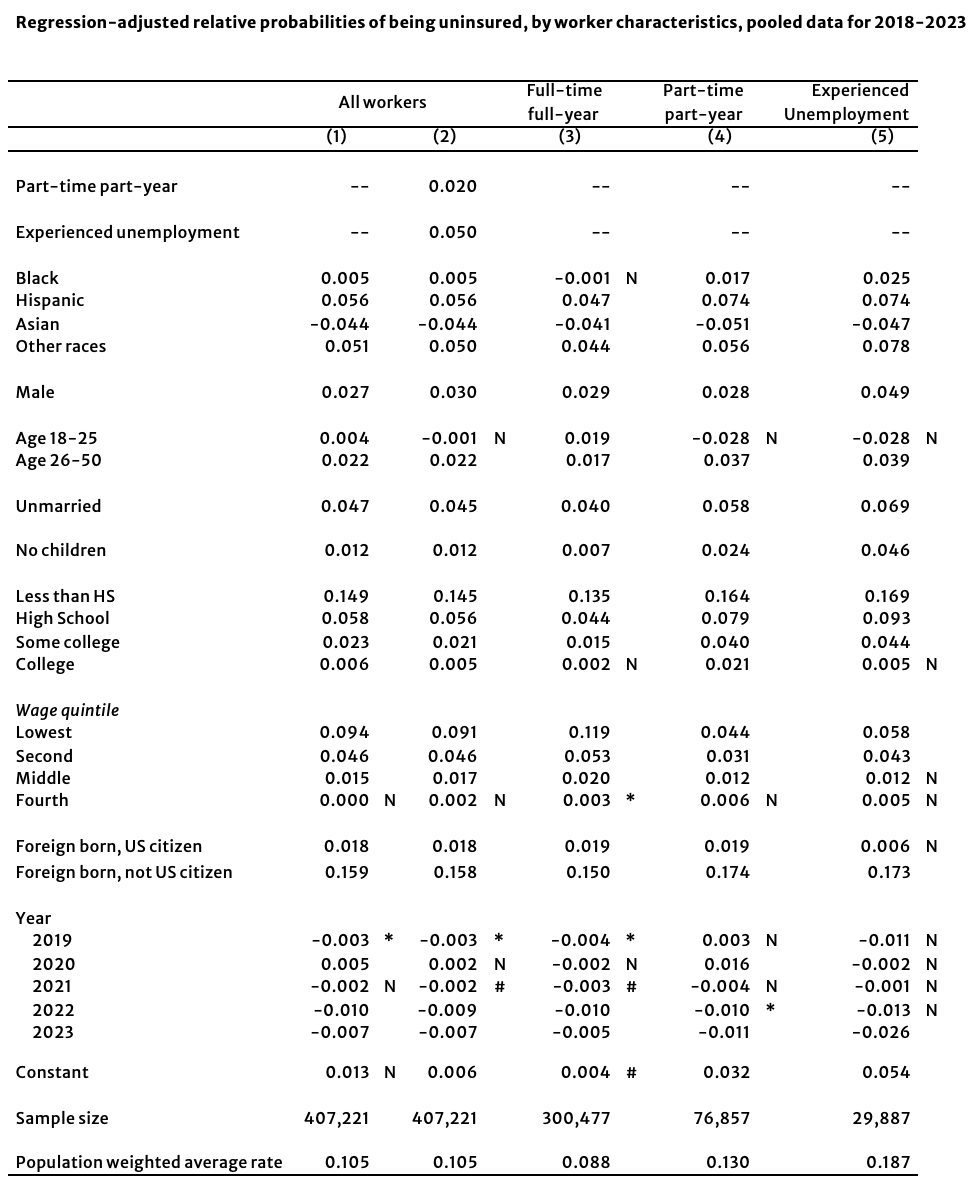
Notes: Unless otherwise indicated, all coefficients are statistically significant the 1% level; * indicates the 5% level; # indicates significance at the 10% level; “N” indicates not statistically significant at at least the 10% level. Those without health insurance reported having no health insurance from any source during the entire calendar year. Unemployed group composed of those who experienced any spell of unemployment during the calendar year, regardless of full-time or full-year status when employed.
Source: Authors’ analysis of the IPUMS extract of the Current Population Survey’s Annual Social and Economic supplement, 2019-2024.
Table 6 provides estimates by demographic group of the number of workers who were without health insurance for the entire year in 2023. Prior tables pooled the data for the years 2018 through 2023 in order to give a sharper picture of the circumstances of smaller demographic groups. In order to provide the most up-to-date estimate of the size of the uninsured population, Table 6 instead looks only at information collected in the spring of 2024, which covered the calendar year 2023, the most recent data available.
Table 6 shows that about 15.9 million workers – 9.9 million men and 6.0 million women – lacked health insurance for all twelve months of 2023. About 10.2 million of the uninsured worked full-time during the entire year. Another 3.7 million worked in part-time jobs or in full-time jobs part of the year. Over 11 million of the uninsured were in the bottom 40 percent of wage earners, with 6.6 million in the bottom 20 percent. But even 2.6 million workers with college or advanced degrees lacked health insurance in 2023. More than two-thirds (10.9 million) were US citizens.
Table 6

Notes: Those without health insurance reported having no health insurance from any source during the entire calendar year. Unemployed group composed of those who experienced any spell of unemployment during the calendar year, regardless of full-time or full-year status when employed. Wage quintiles have been scaled to sum to overall total.
Source: Authors’ analysis of the IPUMS extract of the Current Population Survey’s Annual Social and Economic supplement, 2024.
The Affordable Care Act greatly increased access to health insurance coverage across every demographic group in the US population. The ACA had its biggest impact on workers between the ages of 18 and 64, primarily by expanding Medicaid eligibility to low-income workers and by providing subsidized access to private health insurance through the newly created health exchanges. But, as we document here, despite these important gains, almost 16 million workers remain uninsured, where being uninsured means that they lacked health insurance for the entire calendar year, not just at a particular point in time. These uninsured workers include over 10 million in year-round, full-time employment and more than 2.5 million with four-year college degrees or more. The groups most likely to be uninsured are low-wage workers in low-income households: 11.1 million of the uninsured are in the bottom 40 percent of wage earners.
In percentage terms, the demographic groups in which workers are most likely to be uninsured are: Hispanic workers (23.2 percent for all workers), Black workers (11.5 percent), 18-25 year-olds (13.9 percent), and foreign-born, non-US citizens (31.3 percent). There is also a notable gender gap among workers; 8.5 percent of women are uninsured, while the rate for men is 12.4 percent.
The ACA substantially improved access to health insurance coverage for tens of millions of US workers. But even after its full implementation, the ACA leaves almost 16 million workers entirely uninsured, including more than 10 million who work all year long in full-time jobs.
We thank Algernon Austin, Julie Cai, Shawn Fremstad, and Peter Hart for their assistance and comments on drafts of this report.
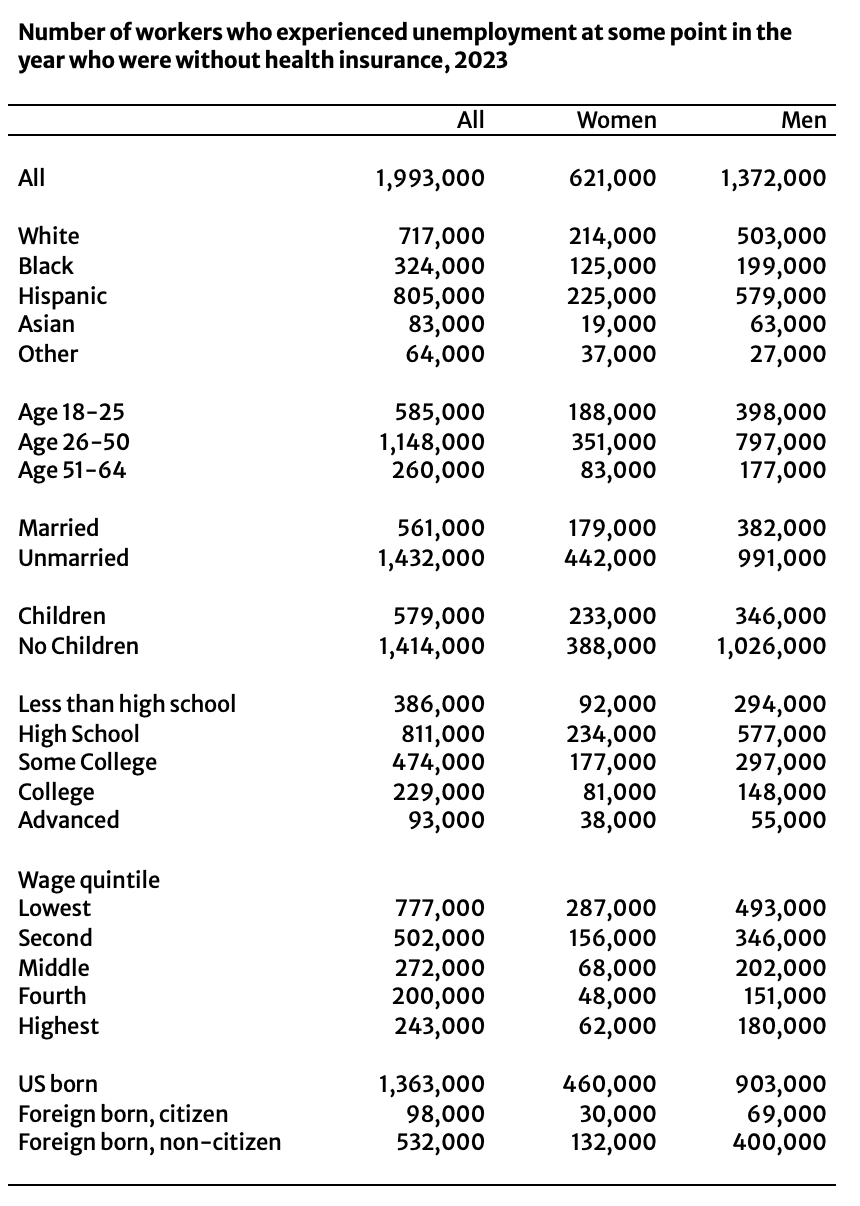
Appendix Table 1

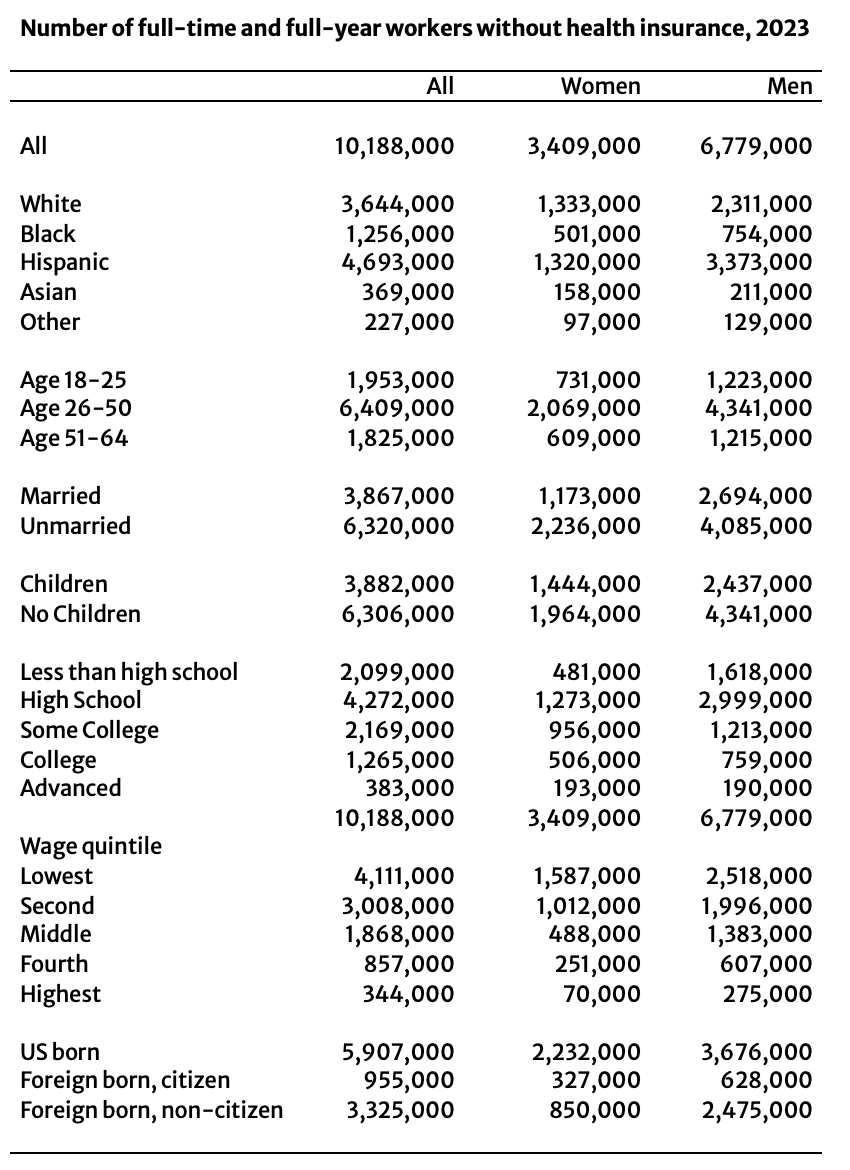
Notes: Those without health insurance reported having no health insurance from any source during the entire calendar year. Unemployed group composed of those who experienced any spell of unemployment during the calendar year, regardless of full-time or full-year status when employed.
Source: Authors’ analysis of the IPUMS extract of the Current Population Survey’s Annual Social and Economic supplement, 2024.
Appendix Table 2

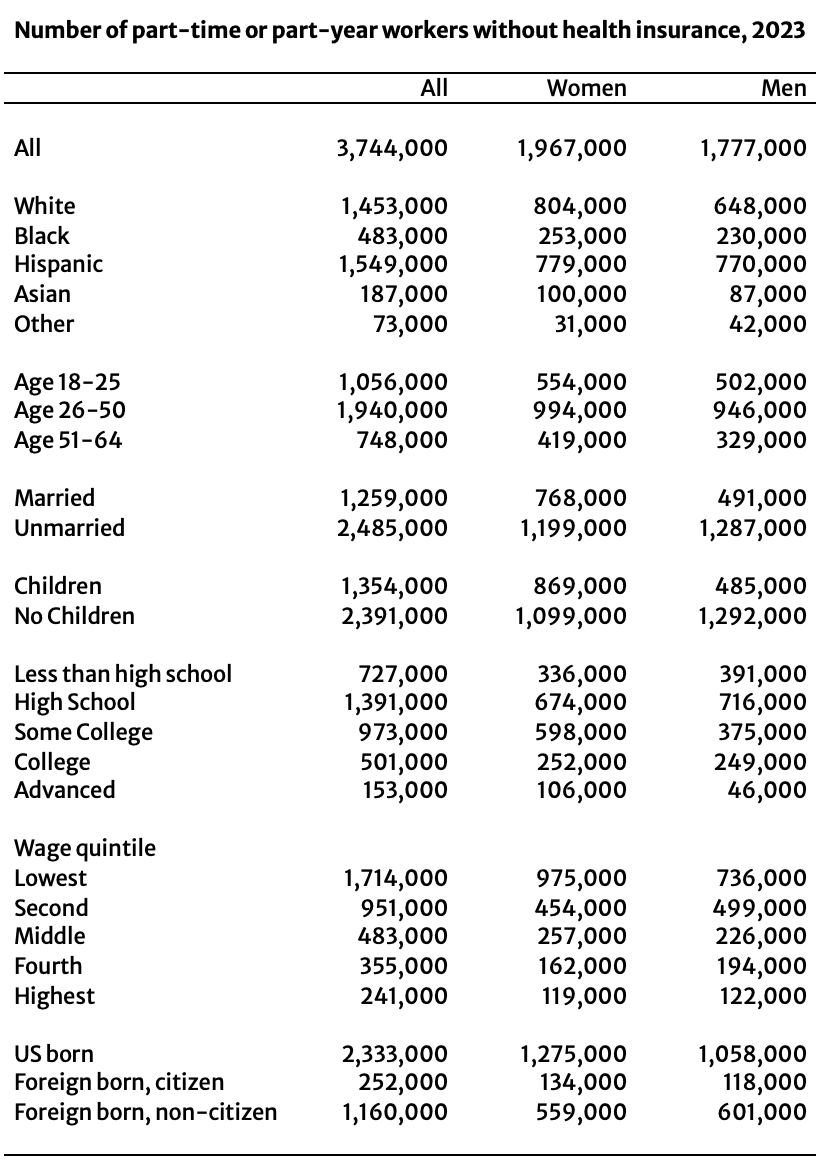
Notes: Those without health insurance reported having no health insurance from any source during the entire calendar year. Unemployed group composed of those who experienced any spell of unemployment during the calendar year, regardless of full-time or full-year status when employed.
Source: Authors’ analysis of the IPUMS extract of the Current Population Survey’s Annual Social and Economic supplement, 2024.
Appendix Table 3

Notes: Those without health insurance reported having no health insurance from any source during the entire calendar year. Unemployed group composed of those who experienced any spell of unemployment during the calendar year, regardless of full-time or full-year status when employed.
Source: Authors’ analysis of the IPUMS extract of the Current Population Survey’s Annual Social and Economic supplement, 2019-2024.
Article

Article

Article

Podcast