Report
Financial Struggles of Working-Class Women Reveal Potential for More Robust Family-Friendly Policy Response

Report
Julie Cai thanks Eileen Appelbaum, Marybeth Mattingly, and Alix Gould-Werth for their valuable comments, and Karen Conner, Sarah Rawlins, and Matt Sedlar for able editorial preparation. Part of the present analyses are enriched by being conducted while Julie Cai is a visiting fellow at the Federal Reserve Bank of Boston. The views expressed are those of the authors and do not necessarily reflect those of the Federal Reserve Bank of Boston, the Federal Reserve System, or its Board of Governors.
In 2021, the economy added more jobs than it had in nearly two decades. Despite the fact that women’s labor force participation rates have approximately returned to pre-pandemic levels,1 working-class women and mothers are still lagging behind.
Women who stay in low-wage jobs or who are employed in the service sector may experience volatile hours, affecting their take-home pay, not to mention the stress they may bring home to their children. Overall economic gains did not flow to the working class, exposing the deep veins of inequality that run through the US economic system.
Higher rates of job switching during the recovery phase of the pandemic recession may signal a critical need to develop more responsive, family-based economic policies and workplace practices that can transform bad jobs into better jobs. Specifically, policies and practices need to ensure greater income security, better pay, and more stable scheduling that helps stabilize the week-to-week or month-to-month family financial situations.
Historically, women’s poverty rates have been higher than men’s for nearly all races and ethnicities, whether measured using the official poverty measure or the supplemental poverty measure (SPM).2 3 This is despite increased overall female participation in the labor force over the last half century and the consistently high frequency of nonwhite mothers’ employment, which has increased considerably over the past few decades. Even in 2020, a year with massive government economic response to the pandemic, women still had a higher SPM poverty rate relative to men nationwide, even with a poverty measure that accounts for all sources of government transfers and net of tax. 4
The intersection of educational attainment, family structure, and the low-wage labor market may jointly shape women’s economic well-being. In 2020, nearly five-in-nine workers in the US were paid hourly wages as opposed to annual salaries.5 More than 77 percent of wage workers do not hold a bachelor’s degree (as compared to only 36.7 percent of salaried workers).6
Although pay levels have long affected the financial well-being of workers, particularly those employed in the service sector, the prevalence of unstable working hours is drawing new attention from researchers and policy makers. Besides those in food service and retail, service sector jobs may include work in health care, building cleaning or maintenance, and care work—a sector where women are overwhelmingly employed.
Adding a child to these families may pose additional financial challenges, especially to sole caregivers (mostly mothers). High childcare costs often push families with young children into poverty.7 It is not uncommon for these families to have insufficient resources and liquid assets to buffer the negative consequences of work volatility.
This brief examines three aspects of economic security facing women in recent years: poverty, instability in working hours, and a lack of financial savings, with special attention paid to less-educated women with children.
Key Findings:
Gender Disparities
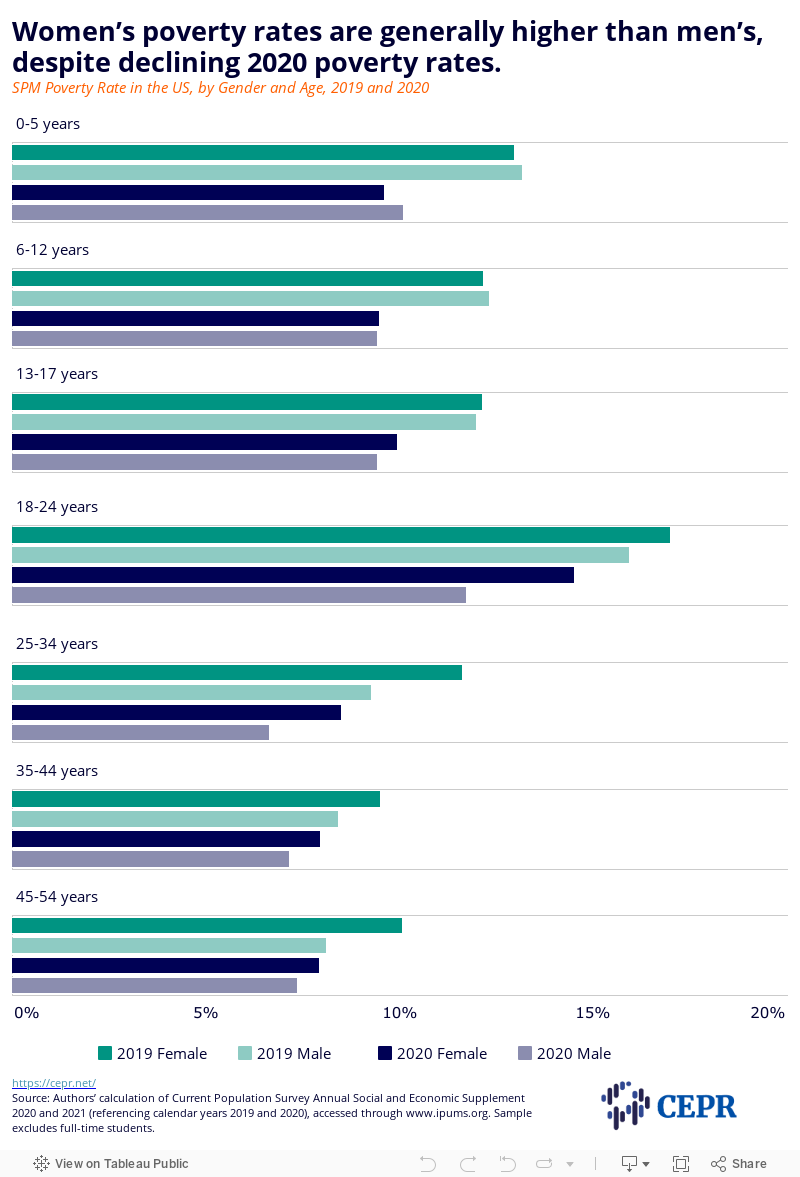
Using the supplemental poverty measure, Figure 1 shows gender differences in 2020 poverty rates by age relative to 2019. Thanks to the federal stimulus payment in 2020, almost every age group experienced a decline in their poverty rates when compared to 2019. However, gender disparity persists.
Childbearing and rearing may hinder women’s careers, even pushing women into poverty.8 SPM poverty rates for males and females are relatively identical through childhood but rise considerably for women as they enter childbearing ages (see Figure 1). Also, rates for women are especially higher than men when they are just entering work. Young adults, between 18 to 34, saw a striking gender disparity in poverty.
Figure 1
Working-Class Disparities in Poverty
The lack of a college degree is used as a proxy to capture the working class. Table 1 describes the gender gap in SPM poverty rates among the working class by race and ethnicity over women’s childbearing years. A more noticeable gender disparity in poverty rates is seen among adults with less than a college degree.
The largest gap between noncollege-educated women and men is more than 5 percentage points for 21-to-24-year-olds, and this gender difference strikingly reaches 13 percentage points among young Black adults (Table 1). Noncollege-educated adults between 25 to 34 also have a substantial gender disparity in the SPM poverty rate. It is mostly driven by a gender gap among Black adults, suggesting Black women without a college degree are disproportionally more likely to fall under the poverty line.
| Female | Male | Percentage point difference |
|
|---|---|---|---|
| Ages 21-24 | |||
| National average | 16.7 | 11.1 | 5.5 |
| Asian | 19.1 | 13.9 | 5.2 |
| Black | 24.6 | 11.5 | 13.2 |
| Hispanic | 17.0 | 14.9 | 2.1 |
| White | 13.5 | 9.1 | 4.4 |
| Ages 25-34 | |||
| National average | 12.9 | 8.6 | 4.2 |
| Asian | 13.2 | 8.4 | 4.8 |
| Black | 19.8 | 9.2 | 10.6 |
| Hispanic | 15.2 | 12.4 | 2.8 |
| White | 8.7 | 6.4 | 2.3 |
| Ages 35-44 | |||
| National average | 12.1 | 9.9 | 2.2 |
| Asian | 12.9 | 9.6 | 3.3 |
| Black | 18.7 | 14.5 | 4.2 |
| Hispanic | 15.2 | 15.2 | 0.0 |
| White | 8.1 | 6.1 | 2.0 |
| Ages 45-54 | |||
| National average | 11.0 | 10.0 | 1.0 |
| Asian | 11.0 | 13.1 | -2.2 |
| Black | 16.8 | 15.4 | 1.4 |
| Hispanic | 14.4 | 14.9 | -0.5 |
| White | 7.7 | 6.7 | 1.0 |
Note: Authors’ calculation of Current Population Survey Annual Social and Economic Supplement 2021 (referencing calendar year 2020), accessed through www.ipums.org. Sample excludes full-time students. Asian, Black, and White groups do not include individuals who identify as Hispanic. The working class is defined as those with less than a college degree.
Noncollege-educated women, between 25 to 34, have a poverty rate of 13 percent, compared to 9 percent for their male counterparts. Black women in that same age group without a college degree have a poverty rate more than 10.5 percentage points higher than Black men in the same age range. This overall gender gap remains significant as they age. Among people without a college degree, 12 percent of women between 35 and 44 live under the SPM poverty line, over 2 percentage points higher than men in the same age range.
Class Disparities by State
As a protective factor, having a college degree generally places women (especially women with children) in a better position in terms of job quality and financial security. Table 2 shows how working-class mothers, 25 or older, fared across various states in 2020.
Nationwide, approximately 15 percent of noncollege-educated mothers live in households with incomes below the SPM line, triple the rate of their higher-educated peers. It is worth mentioning that the poverty threshold used here takes into account geographic differences in the cost of living, and the income measure uses a more inclusive definition of economic resources, including those from cohabiting partners and their relatives.
| Mothers w/o College Degree | Mothers w/College Degree | |
|---|---|---|
| National average | 15.4% | 5.0% |
| District of Columbia | 51.2% | 6.8% |
| North Carolina | 25.0% | 4.4% |
| Alaska | 21.9% | 4.2% |
| Tennessee | 21.2% | 4.8% |
| California | 21.0% | 6.3% |
| Virginia | 19.7% | 3.6% |
| South Dakota | 18.9% | 2.6% |
| Florida | 18.7% | 8.4% |
| South Carolina | 18.6% | 4.4% |
| Georgia | 17.1% | 5.8% |
| Missouri | 17.0% | 4.4% |
| Kentucky | 16.8% | 2.5% |
| Rhode Island | 16.8% | 5.0% |
| Texas | 16.3% | 5.2% |
| Maryland | 16.2% | 6.6% |
| Delaware | 16.0% | 5.1% |
| New York | 15.8% | 8.7% |
| New Mexico | 15.5% | 3.0% |
| Kansas | 15.3% | 2.2% |
| Vermont | 14.5% | 2.2% |
| Alabama | 14.5% | 3.9% |
| Wyoming | 14.5% | 3.4% |
| Minnesota | 14.5% | 0.4% |
| Mississippi | 14.1% | 6.1% |
| Connecticut | 13.6% | 9.7% |
| New Jersey | 13.6% | 4.7% |
| Louisiana | 13.3% | 5.5% |
| Colorado | 13.3% | 4.8% |
| Indiana | 13.2% | 2.2% |
| Pennsylvania | 13.1% | 1.9% |
| Oklahoma | 12.9% | 2.4% |
| Arizona | 12.7% | 5.8% |
| Michigan | 12.5% | 5.3% |
| West Virginia | 11.9% | 1.9% |
| Massachusetts | 10.8% | 3.8% |
| Illinois | 10.8% | 3.9% |
| Nebraska | 10.8% | 2.5% |
| Washington | 10.8% | 4.4% |
| Arkansas | 10.5% | 5.2% |
| Hawaii | 10.4% | 6.0% |
| Ohio | 8.6% | 6.1% |
| Idaho | 8.5% | 3.7% |
| Maine | 8.1% | — |
| Oregon | 7.9% | 4.1% |
| Montana | 7.2% | 4.3% |
| North Dakota | 7.1% | 4.1% |
| Utah | 6.5% | 4.0% |
| Nevada | 6.3% | 8.6% |
| Iowa | 6.1% | 1.6% |
| Wisconsin | 6.0% | 2.0% |
| New Hampshire | 2.3% | 1.4% |
Note: Sample is restricted to women (25 or older) who are not full-time students and live with at least one child under 18. Authors’ calculation of Current Population Survey Annual Social and Economic Supplement 2021 (referencing calendar year 2020). Estimate for college-educated mothers in Maine is unavailable due to small sample size.
One-third of US states have higher than national average SPM poverty rates for working-class mothers, with the District of Columbia and North Carolina topping the list. Slightly over half of DC’s noncollege-educated mothers have incomes below the poverty line, compared to 7 percent of mothers with a college degree.
California, Florida, and Georgia are among the top 10 worst states for mothers without a college degree, where 17 to 21 percent are SPM poor. Some other states with high GDPs, such as Texas and New York, are no exception. Mothers without a college degree in Utah, Wisconsin, and New Hampshire appear to fare better overall in terms of poverty.
Recent studies have documented the harmful effects of unstable or unpredictable schedules on the well-being of service sector workers and single mothers, including worse psychological stress, poor sleep quality,9 and worse behaviors for children living with single mothers.10
Holding a job is important for most contemporary women, but working unstable hours from week to week or not knowing the number of hours in future weeks may present planning challenges, especially for mothers with childcare duties. Besides employer-driven reduced hours, some low-income or single mothers may have to work less to accommodate their children’s needs if they are the sole caregiver and simply cannot afford childcare costs.
Using a subsample of the monthly Current Population Survey (CPS) data, Figures 2 and 3 show how female workers fare in terms of month-to-month work-hour instability11 by parental status among the working-class women as a whole and women employed in the service sector, respectively.
Among all female workers with less than a college degree, volatility increased by relatively the same amount across various family configurations from 2019 to 2020 (Figure 2). This rise is particularly salient for mothers employed in the service sector. In 2020, work-hour volatility reached its highest level for service sector unmarried mothers (Figure 3).
Figure 2
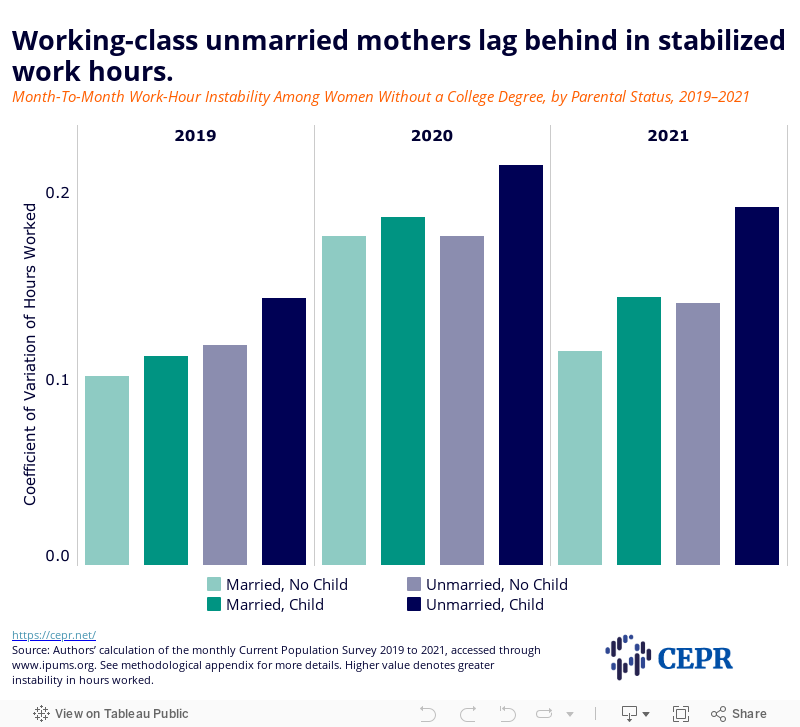
Figure 3
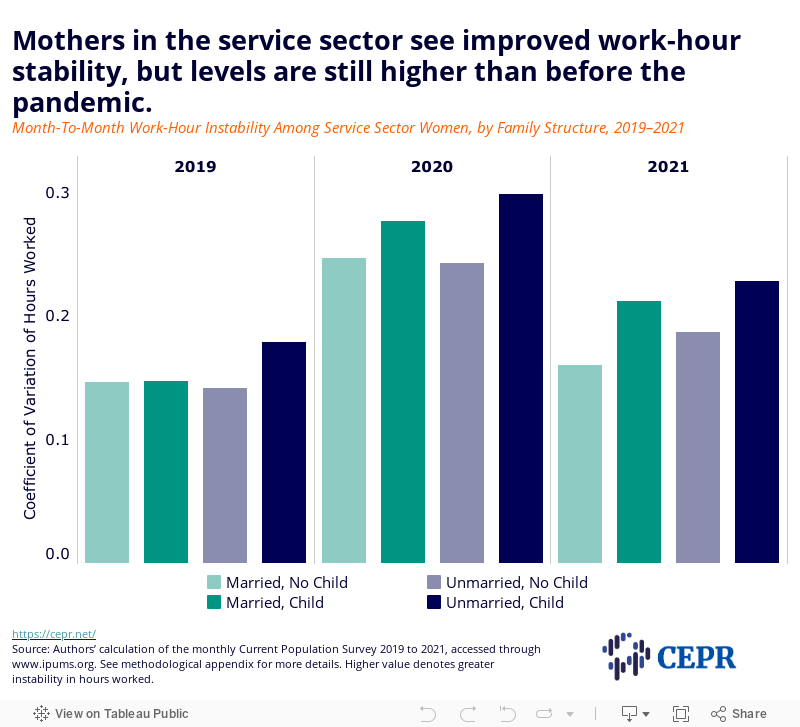
In 2021, during the pandemic recovery phase, downward trends in work-hour variability were observed in both the working-class women as a whole and women working in the service sector. However, the decline was uneven, leaving unmarried mothers behind. The good news is that women in the service sector saw a substantial drop in the amount of volatility, though it did not fully return to the 2019 level.
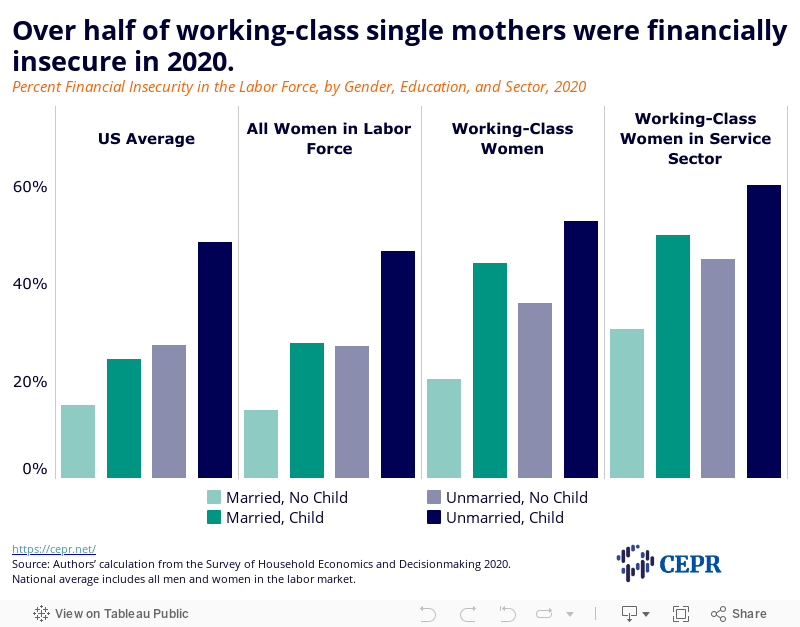
Although working-class women appear to be more insecure financially, relative to the national average, large differences exist in parental and marital status (see Figure 4). Over 52 percent of single mothers without a college degree reported they needed to take loans or borrow money for a $400 emergency expense. The percentages are even higher for mothers working in the service sectors, irrespective of marital status. Not surprisingly, these women workers were least likely to have their retirement savings plan on track during the pandemic or not even have a retirement plan.
Figure 4
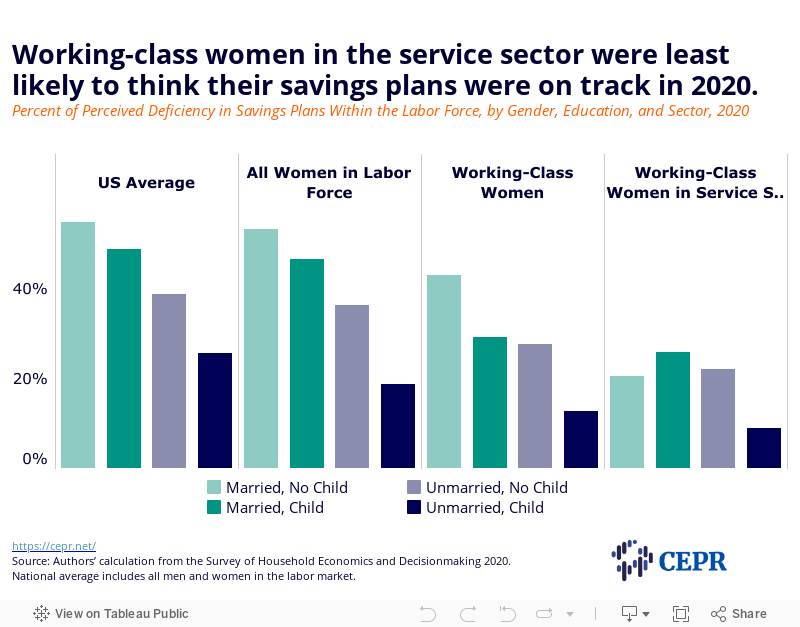
In 2020, women were less likely to think their savings plan was on track than their male counterparts. Among women, this negative forecast was worse for working-class women and worse still for those working in the service sector (see Figure 5).
Living arrangements influence people’s perceptions of financial savings. Among noncollege-educated women employed in the service sector, only one-in-ten unmarried women with children felt positive about their saving plan (see Figure 5). This is a drastic contrast to the circumstances of single parents nationwide; at least one-in-four thought their savings plan was on track. Over half of childless married individuals were confident about their savings plans.
Figure 5
Although various reasons exist that cause women, particularly noncollege-educated women, to be financially insecure, the results presented in this brief may indirectly contribute to policy efforts that would benefit low-income women and mothers.
The higher month-to-month hours instability observed for less-educated, unmarried mothers, particularly those employed in the service sector, may have a closer link to their financial circumstances.
Most of the causes of work instability for low-income or less-educated women are involuntary, such as employers cutting costs by reducing employees’ hours or making last-minute work schedule changes.12 Research shows that enforcing fair work-hour protections relieves stress for parents raising young children13 and promotes financial stability for the working class, particularly parents.
Implementing fair workweek policies could foster more stable workplaces and improve the economic stability of workers and their families. Currently, only a handful of areas have fair scheduling practices in place.
Poverty rates for women increase as they enter childbearing ages and are generally higher than men. Attaining a college degree is shown to prevent many women and mothers from falling into poverty. However, the salient gender disparity in the SPM poverty rate among the working class remains, particularly for the noncollege-educated Black women.
In addition, single parenthood may further exacerbate financial insecurity for women. Current results indicate that negative feelings about personal savings plans were most prevalent among single women with children, suggesting they have fewer income resources. One-in-two working-class single mothers reported they could not come up with $400 in an emergency during 2020, and they were the least likely to have healthy savings plans.
A child benefit paid out on a monthly basis would make a difference in the family economics of low-income or working-class mothers. Although this may not address women’s savings outcomes in a short run, having a monthly guaranteed payment could help working-class mothers in low-income households cope with month-to-month income swings due to unstable hours.
Parents may have to sacrifice work hours or leave the labor market to perform caregiving duties. Long overdue family-friendly policies such as affordable childcare programs and paid leave would benefit working-class mothers tremendously and yield positive outcomes for children in the coming years.
The analyses in this brief are based on multiple data sources. All analyses are weighted. Working-class women are defined as women holding less than a four-year college degree. Mothers include women living with at least a biological child under the age of 18.
Workers employed in the service sectors are used as a proxy for low-income workers. The service sector includes workers in any of these five occupational categories: health care aides, protective service, food preparation and serving, building and grounds cleaning, and personal care and service.
All 2020 poverty rates are calculated based on the supplemental poverty measure using CPS ASEC 2021 data.14 The sample excludes full-time students.
The Instability in Work Hours section is based on the panel data of the monthly CPS 2019 to 2021. It follows the same individual across four months. Instability in hours worked is calculated using the coefficient of variation approach. The sample includes female workers (ages between 19 and 65) who do not miss work or work part time due to the following reasons: taking vacation/personal days, attending school, own illness, family obligation, taking parental leave, or having civic duty. Marital status does not consider whether a cohabiting partner is present in the household; therefore, unmarried workers may include cohabiting partners.
The Financial Insecurity section is based on 2020 data from the Survey of Household Economics and Decisionmaking (SHED), which directly asked respondents whether they thought their retirement savings plan was on track at the time of the interview.
Also, there is a series of questions pertaining to various ways interviewees pay for the expense if you have an emergency expense that costs $400. Respondents answering any of the following measures are grouped as having to borrow money for an emergency expense: taking a bank loan, borrowing from a friend or family member, using a payday loan or overdraft, selling something, or would not be able to pay at all.
Ananat, Elizabeth, Anna Gassman-Pines, and John Fitz-Henley II. “The Effects of the Emeryville Fair Workweek Ordinance on the Daily Lives of Low-Wage Workers and their Families.” No. w29792. National Bureau of Economic Research, 2022.
Bureau of Labor Statistics. “Characteristics of minimum wage workers, 2020.” (2021). https://www.bls.gov/opub/reports/minimum-wage/2020/home.htm
Bureau of Labor Statistics. Labor Force Participation Rate – Women [LNS11300002], retrieved from FRED, Federal Reserve Bank of St. Louis; https://fred.stlouisfed.org/series/LNS11300002, April 26, 2022.
Flood, Sarah, Miriam King, Renae Rodgers, Steven Ruggles, J. Robert Warren and Michael Westberry. Integrated Public Use Microdata Series, Current Population Survey: Version 9.0 [dataset]. Minneapolis, MN: IPUMS, 2021. https://doi.org/10.18128/D030.V9.0
Fox, Liana and Kalee Burns. “The Supplemental Poverty Measure: 2020.” Census Bureau, (2021), retrieved from https://www.census.gov/library/publications/2021/demo/p60-275.html
Lambert, Susan. “Fair work schedules for the U.S. economy and society: What’s reasonable, feasible, and effective.” (Washington: Washington Center for Equitable Growth, 2020), retrieved from https://equitablegrowth.org/wp-content/uploads/2020/02/Lambert.pdf.
Mattingly, Marybeth J. and Christopher Wimer, “Child Care Expenses Push Many Families Into Poverty.” The Carsey School of Public Policy at the Scholars’ Repository. 304. (2017). https://scholars.unh.edu/carsey/304
Misra, Joya, Michelle J. Budig, and Stephanie Moller. “Reconciliation policies and the effects of motherhood on employment, earnings and poverty.” Journal of Comparative Policy Analysis 9, no. 2 (2007): 135-155.
Pilkauskas, Natasha V., Jeanne Brooks-Gunn, and Jane Waldfogel. “Maternal employment stability in early childhood: Links with child behavior and cognitive skills.” Developmental psychology 54, no. 3 (2018): 410.
Schneider, Daniel, and Kristen Harknett. “Consequences of routine work-schedule instability for worker health and well-being.” American Sociological Review 84, no. 1 (2019): 82-114.
Shrider, Emily, Melissa Kollar, Frances Chen, and Jessica Semega. “Income and Poverty in the United States: 2020.” Census Bureau, (2021), retrieved from https://www.census.gov/library/publications/2021/demo/p60-273.html
Report

Article

Report

Report