Report
High Joblessness for Black Youth: More Than 500,000 Jobs are Needed

Report
The author thanks Julia Godfrey and Annabel Utz for research assistance, Karen Conner, Sarah Rawlins, and Matt Sedlar for editorial assistance, and Dean Baker for editorial review. This research was funded by the Annie E. Casey Foundation. We thank them for their support but acknowledge that the findings and conclusions presented in this report are those of the author alone, and do not necessarily reflect the opinions of the Foundation.
Black youth should have a higher rate of employment than white youth since they have a greater need to work. In general, Black youth have less wealth and a higher poverty rate than white youth. Black youth are less likely to pursue a bachelor’s or advanced degree, and, if they do, they are more likely to drop out of college than white youth. Black youth are more likely to start a family before 25 than white youth.
Unfortunately, because of antiblack discrimination in the labor market and other factors, Black youth work less than white youth. There is a very high rate of joblessness among Black youth relative to their white peers — higher than even that suggested by the unemployment rate. This high rate of joblessness sets many Black youths on a troubled path into adulthood, a path that will also cause difficulties for their children.
In this report, “youth” and “young” will refer to individuals 16 to 24 years old, except where otherwise indicated.
Black youth have lower educational attainment than white youth and, therefore, should start full-time work earlier than white youth. About half of Black high school graduates go on to post-secondary education, but two-thirds of white high school graduates do the same.1 Of the individuals who pursue post-secondary education, about 30 percent of white students do not obtain a degree or certificate, but 45 percent of Black students are in this situation.2 Given that many of these individuals without a degree or certificate have student loan debt, it is very important that they find work.
Black youth have a higher birth rate than white youth.3 Therefore, Black youth are more likely to have children that need financial support. For this reason, Black youth should be working at higher rates than white youth.
In general, Black families have only a fraction of the wealth of white families.4 The Black poverty rate is also much higher than the white rate.5 Thus, the average Black youth has a greater economic need to work than white youth.
Figure 1
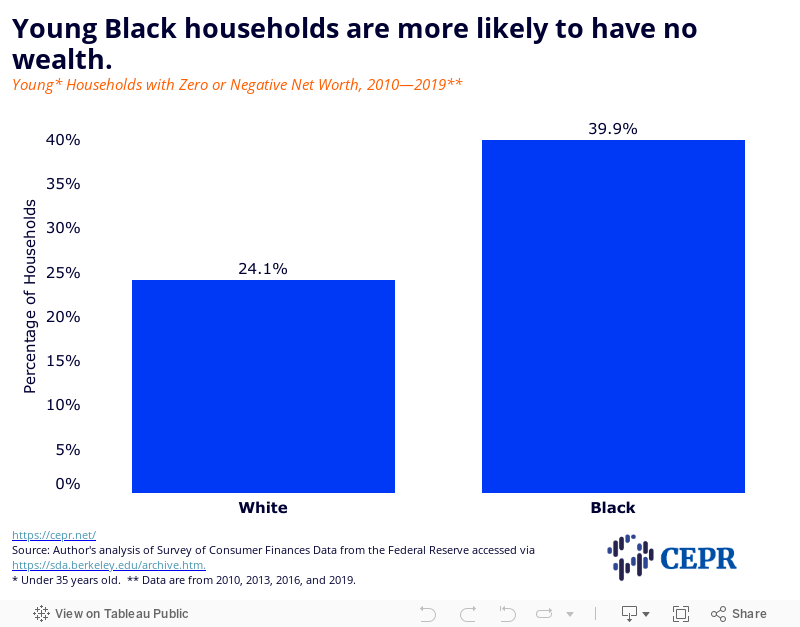
Figure 2
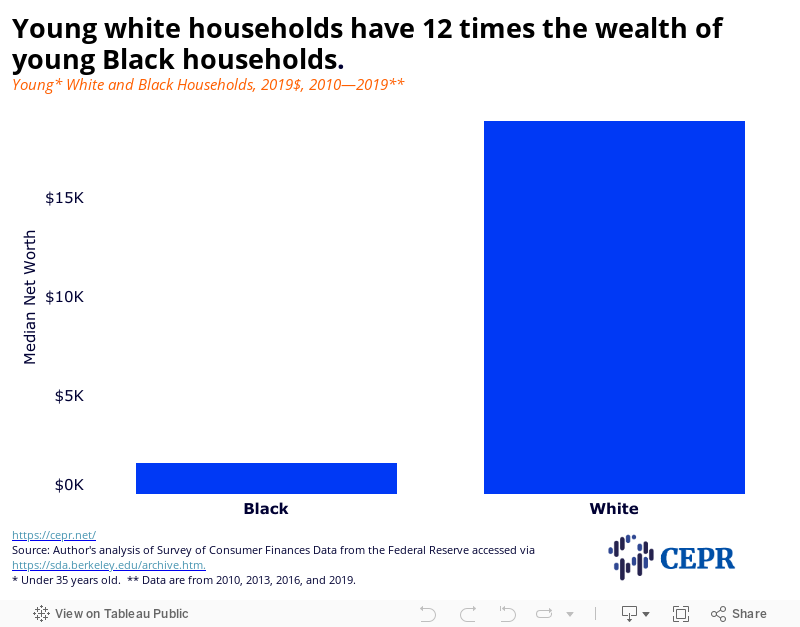
The economic disadvantages of Black youth also apply specifically to households headed by Black youth. Households headed by individuals under 35 are not generally wealthy, but households headed by Black youth are considerably worse off than their white peers. While nearly a quarter of young white households have no wealth or are in debt, about 40 percent of young Black households are in this situation (Figure 1). The median net worth of young white households is approximately 12 times that of Black young households (Figure 2).
Figure 3
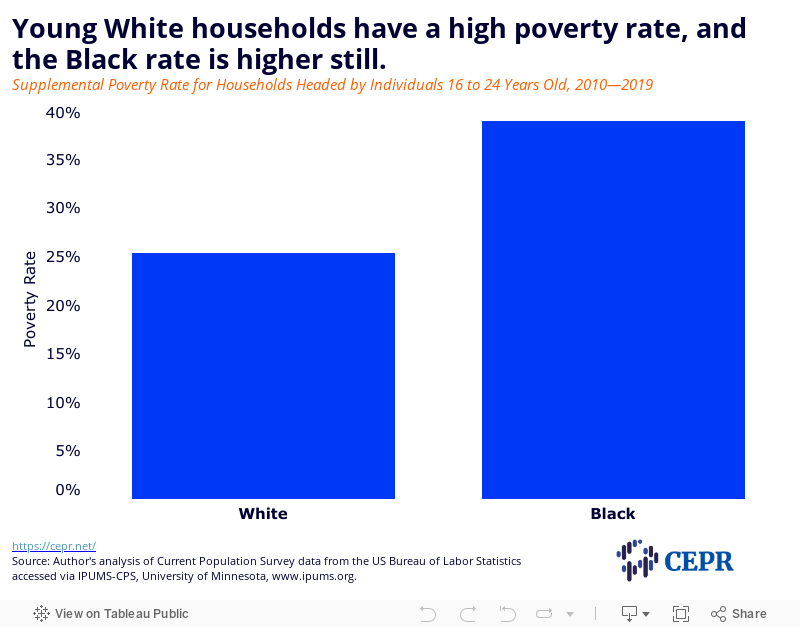
Young households headed by individuals under 25 have high rates of poverty. A quarter of young white households are in poverty (Figure 3). The share is even greater for young Black households where nearly 40 percent are in poverty.
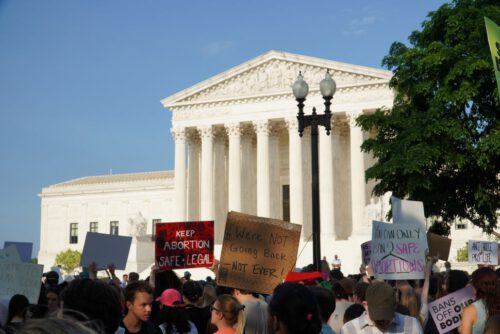
Because of the US Supreme Court’s Dobbs v. Jackson’s Women’s Health Organization decision, many Black youth will be denied access to abortion. At the time of this writing, about half of Black youth but only about 40 percent of white youth reside in states where abortion is banned, will be banned, or has strong restrictions.6 The abortion rate for Black females is significantly higher than for white females.7
Conservative lawmakers will force proportionally more Black youth to have children when they are not ready. (The data suggest that few women consider adoption to be an alternative to abortion.8 The choice is between having an abortion or becoming a parent.) As the conservative policy expert Stuart Butler has noted, these conservative lawmakers tend to be “very strongly pro-life, but at the same time [they are] very strongly against expanding government assistance or raising taxes to fund government assistance”9 for needy children. In a post-Roe United States, there is an even greater need for jobs for Black youth who have been forced by conservatives to have children.
Black youth should have a higher rate of employment than white youth since they are less likely to be in school, are more likely to have children to support, and are more likely to have financial hardships. But this is not the case. Black youth work at a substantially lower rate than white youth.
Figure 4
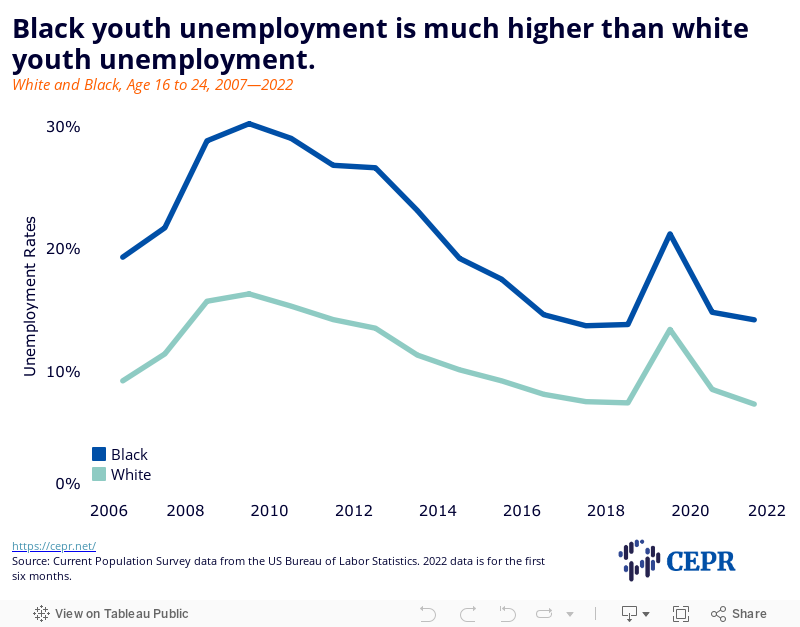
Figure 4 shows the white and Black youth unemployment rates from 2007 to the first half of 2022. This date range shows a complete business cycle from the 2007 peak to the 2019 peak and the more recent years.
Youth unemployment rates are high relative to the overall rate. For the first half of 2022, the overall unemployment rate was 3.8 percent,10 but the unemployment rate for white youth, 16 to 24 years old, was significantly higher at 7.3 percent (Figure 4). While the white youth rate is high relative to the overall rate, it is still much lower than the rate for Black youth. The Black youth unemployment rate was 14.2 percent in the first half of 2022. As illustrated in Figure 4, the unemployment rate for Black youth is consistently higher than the rate for white youth. The Black youth rate has been roughly twice the white youth rate from 2007 to 2022. The ratio shrank some at the start of the pandemic in 2020, but it has widened again.11
The unemployment rate is probably the most popular statistic for assessing the health of the labor market. It is a very useful statistic, but it is less useful for groups that face persistent challenges finding work. To be counted as unemployed, an individual must be “actively” looking for work. Jobless individuals who are looking for work “passively,” or who are not looking for work, are considered to be “not in the labor force” as opposed to unemployed.12
Nevertheless, individuals may want a job or be willing to work even if they are not “actively” looking for work. For example, although the white, prime-age (25-to-54-years-old) labor force has a relatively strong rate of participation, in the wake of the Great Recession, their participation rate sagged in the face of weakened demand for their labor. It did recover, however, as the labor market tightened.13 For Black people who face a persistently weak demand for their labor, who live in areas where there are few job opportunities or who have been repeatedly rejected by employers, their labor force participation rate may be chronically depressed.14 These workers can be considered to be experiencing a “permanent recession.”
For Black workers, the employment-to-population ratio or employment rate — the share of the group that is working — is a better measure than the unemployment rate. The employment rate as a measure sidesteps the technicalities of the official definition of unemployment and gives a more accurate assessment of joblessness when benchmarked against a white peer group. The jobless rate is simply the share of the population that is not employed or 100 percent minus the employment rate.
Although the white youth unemployment rate for the first half of 2022 was 7.3 percent, the white youth employment-to-population ratio or employment rate was 53 percent (Figure 5). According to the employment rate, 47 percent (100 – 53 = 47 percent) of all white youth were jobless. This is a much greater jobless rate than what is suggested by the unemployment rate.
A 53 percent employment rate is low, but for Black youth the rate in the first half of 2022 was only 43.3 percent, significantly lower. This indicates that a majority, 56.7 percent, of Black youth were jobless. The Black youth employment rate is consistently lower than the white rate, although proportionately more Black youth should be employed, not fewer.
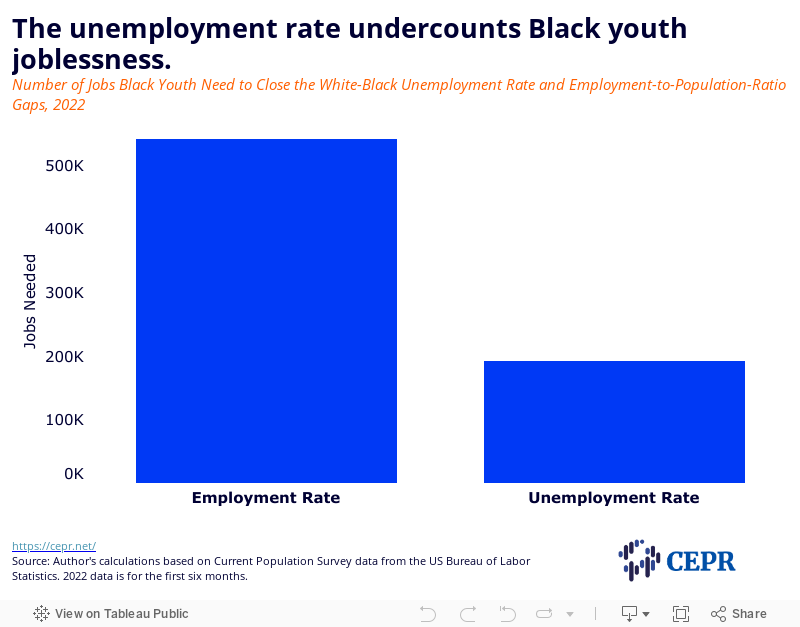
To illustrate the value of using the employment rate, we can compare the number of jobs needed to close the white-Black unemployment rate gap versus the white-Black employment rate gap. In the first half of 2022, the unemployment rate gap could have been closed with 192,000 jobs going to Black youth (Figure 6). To close the employment rate gap would have required nearly three times that number, 540,000 jobs. The unemployment rate dramatically under counts joblessness for groups facing a low demand for their labor.
Figure 5
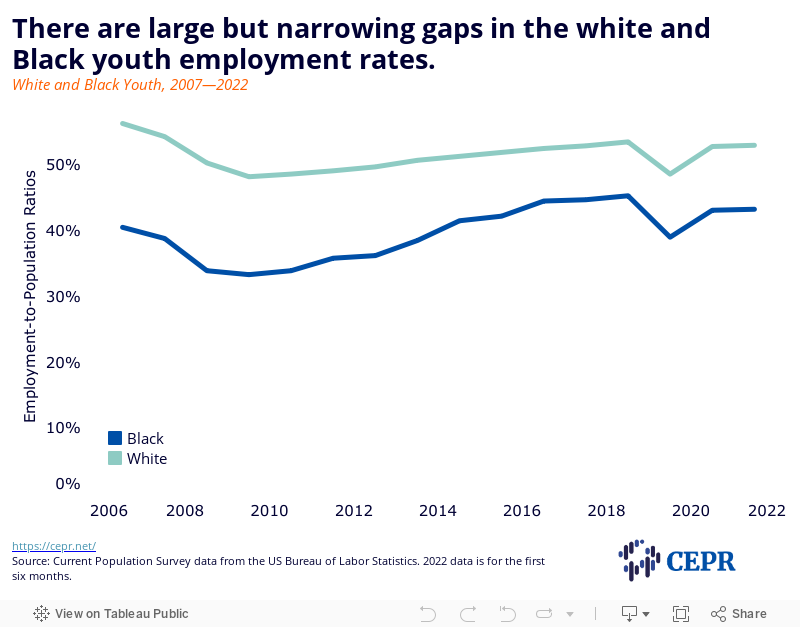
Figure 6
Formal education is more important today than in the past. Some of the longer-term decline in employment for youth is due to more youth dedicating more time to educational activities instead of work.15 Black youth, however, should be less affected by this trend since they are less likely to be enrolled in higher education. Because of the additional economic challenges that Black youth face, even among youth not enrolled in school, Black youth should have a higher rate of employment than white youth.
Figure 7
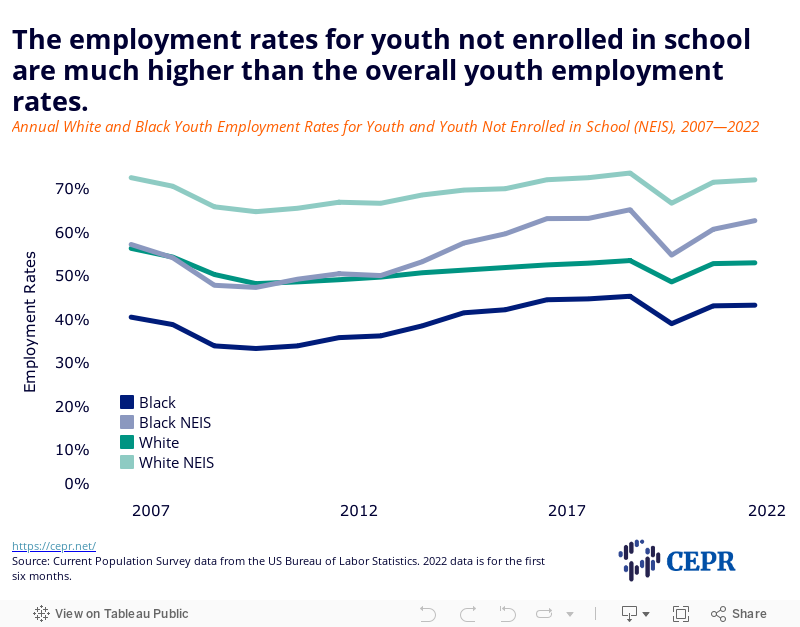
Youth who are not enrolled in school have higher rates of employment than youth overall. This fact can be seen in Figure 7. The white and Black employment rates are higher for the youth who are not in school. In the first half of 2022, the overall white youth employment rate was 53 percent, but it was 72 percent for the white youth not enrolled in school. The overall employment rate for Black youth was 43.3 percent, but it was 62.7 percent for Black youth not enrolled in school. Although the rate for Black youth who are not enrolled in school is higher, it still means that nearly 40 percent of these Black youth are jobless.
When just comparing white and Black youth not enrolled in school, Black youth still have a large 9.36 percentage point deficit in their employment rate. To fill this gap would require 251,000 additional jobs for Black youth.
Figure 8
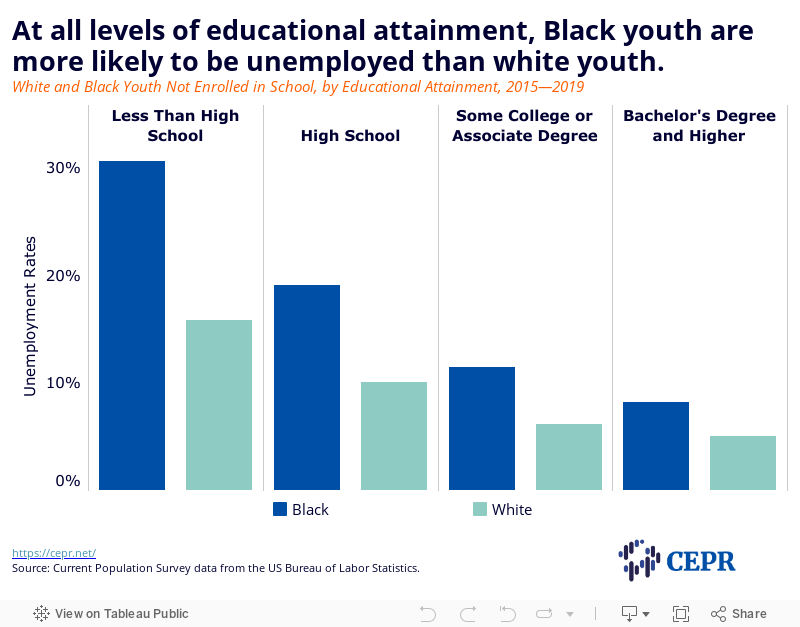
Although Black youth should have a higher rate of employment than white youth, they do not. Some might suspect that this discrepancy is due to differences in human capital, but the findings from examining the unemployment rate by educational attainment challenges this idea. Black youth are more likely to be unemployed than white youth at every level of educational attainment (Figure 8). (The combined 2015 to 2019 data are displayed to show the longer-term patterns free of the disruption caused by the pandemic.)
The disparities are large. To have a lower likelihood of being unemployed than a white high school dropout, a Black youth needs some college or an associate degree. A Black youth needs a bachelor’s degree to have a lower likelihood of being unemployed than a white youth with a high school diploma. This suggests that while education, training, and skills acquisition does increase the odds of Black youth finding work, it is not enough to ensure equal opportunity.
Part of the reason for the differences in white and Black employment outcomes is likely due to racial discrimination in the labor market. Researchers consistently find that employers have a preference for white workers over Black ones. Studies where employers are presented with white and Black job candidates with equivalent qualifications reveal this bias.16 This white preference in the labor market needs to be countered with affirmative action policies.17
Today, if one focuses only on the youth not enrolled in school, Black youth would need 251,000 jobs to have the same employment rate as white youth. A better standard would be to strive for parity with all white youth. To achieve this equality would require more than half a million jobs. Even this standard is conservative since the economic disadvantages that Black youth experience relative to white youth means that they have a greater need for work than white youth.
The Dobbs decision will force many Black youth to have children before they are ready. As illustrated in Figures 1 to 3, young households are at a high risk of economic insecurity due to high rates of poverty and debt. Young people who have children while in school are at increased risk of dropping out,18 which only worsens their and their children’s economic prospects. The Court’s decision will mean that there are more Black youth who need to work to provide for their children.
A subsidized jobs program targeting communities experiencing high levels of joblessness is one approach that can help provide employment for Black youth.19 The country has had a variety of successful subsidized jobs programs of varying scope and scale.20 The largest were the programs created by the Works Progress Administration which helped reduce the national unemployment rate during the Great Depression from 23 percent to 4 percent.21
One New Deal Program, the Civilian Conservation Corps, provided jobs for 200,000 Black male youth during the Great Depression.22 A notable smaller scale program from the 1970s targeting youth was the Youth Incentive Entitlement Pilot Project which provided jobs for 76,000. 23 With bold and smart investments, we can reduce joblessness for Black youth. These programs can reduce social service expenditures and spur economic development which ultimately benefits everyone.
Attewell, Steven. 2018. People Must Live by Work: Direct Job Creation in America, from FDR to Reagan. Philadelphia: University of Pennsylvania Press.
Austin, Algernon. 2021a. “Ending Black America Ending Black America’s Permanent Economic Recession: Direct and Indirect Job Creation and Affirmative Action Are Necessary.” Minnesota Journal of Law and Inequality 39(2), May. https://lawandinequality.org/wp-content/uploads/2021/05/Ending-Black-Americas-Permanent-Economic-Recession_-Direct-and.pdf.
________. 2021b. “The Jobs Crisis for Black Men is a Lot Worse Than You Think.” Center for Economic and Policy Research, December 8. https://cepr.net/publications/the-jobs-crisis-for-black-men-is-a-lot-worse-than-you-think/.
________. 2022. “Request for Information on the Prosperity Gap Submission to the Select Committee on Economic Disparity and Fairness in Growth of the U.S. House of Representatives.” Center for Economic and Policy Research, March 15. https://cepr.net/request-for-information-on-the-prosperity-gap-submission-to-the-select-committee-on-economic-disparity-and-fairness-in-growth-of-the-u-s-house-of-representatives/.
Bhutta, Neil, Andrew C. Chang, Lisa J. Dettling, and Joanne W. Hsu. 2020. “Disparities in Wealth by Race and Ethnicity in the 2019 Survey of Consumer Finances.” FEDS Notes, September 28. https://www.federalreserve.gov/econres/notes/feds-notes/disparities-in-wealth-by-race-and-ethnicity-in-the-2019-survey-of-consumer-finances-20200928.htm.
Cole, Jr., Olen. 1999. The African-American Experience in the Civilian Conservation Corps. Gainsville, FL: University Press of Florida.
Fox, Liana and Kalee Burns. 2021. “The Supplemental Poverty Measure: 2020.” US Census Bureau. https://www.census.gov/library/publications/2021/demo/p60-275.html.
Gueron, Judith M. 1984. “Lessons from a Job Guarantee. The Youth Incentive Entitlement Pilot Projects.” MDRC. https://www.researchgate.net/publication/234718299_Lessons_from_a_Job_Guarantee_The_Youth_Incentive_Entitlement_Pilot_Projects.
KFF. 2022. “Abortion in the U.S. Dashboard.” Accessed July 19, 2022. https://www.kff.org/womens-health-policy/dashboard/abortion-in-the-u-s-dashboard/.
Kortsmit, Katherine, Tara C. Jatlaoui, Michele G. Mandel, Jennifer A. Reeves, Titilope Oduyebo, Emily Petersen, and Maura K. Whiteman. 2020. “Abortion Surveillance — United States, 2018.” Morbidity and Mortality Weekly Report, November 27. https://www.cdc.gov/mmwr/volumes/69/ss/ss6907a1.htm.
Loprest, Pamela, Shayne Spaulding, and Demetra Smith Nightingale. 2019. “Disconnected Young Adults: Increasing Engagement and Opportunity.” RSF: The Russell Sage Foundation Journal of the Social Sciences December, 5 (5) 221-243; DOI: https://doi.org/10.7758/RSF.2019.5.5.11.
National Center for Education Statistics. 2021. “Table 302.20. Percentage of recent high school completers enrolled in college, by race/ethnicity: 1960 through 2020,” Digest of Education Statistics. https://nces.ed.gov/programs/digest/d21/tables/dt21_302.20.asp.
National Center for Health Statistics. 2021. “Table 1. Crude birth rates, fertility rates, and birth rates, by age, race, and Hispanic origin of mother: United States, selected years 1950–2018,” Health, United States, 2019. https://www.cdc.gov/nchs/data/hus/2019/001-508.pdf.
NPR. 2022. “Many states have anti-abortion laws. Will they provide a social safety net for moms?” https://www.npr.org/2022/07/13/1111244809/many-states-have-anti-abortion-laws-will-they-provide-a-social-safety-net-for-mo.
Quillian, Lincoln, Devah Pager, Ole Hexela, and Arnfinn H. Midtbøen. 2017. “Meta-analysis of field experiments shows no change in racial discrimination in hiring over time.” PNAS, October 10, vol. 114, no. 41. www.pnas.org/cgi/doi/10.1073/pnas.1706255114.
Ruggles, Steven, Sarah Flood, Ronald Goeken, Megan Schouweiler and Matthew Sobek. 2022. IPUMS USA: Version 12.0 [dataset]. Minneapolis, MN: IPUMS. https://doi.org/10.18128/D010.V12.0.
Sisson, Gretchen, Lauren Ralph, Heather Gould, and Diana Greene Foster. 2017. “Adoption Decision Making among Women Seeking Abortion.” Women’s Health Issues, Mar-Apr, 27(2):136-144. doi: 10.1016/j.whi.2016.11.007.
Tate, Emily. 2017. “Graduation Rates and Race.” Inside Higher Ed, April 26. https://www.insidehighered.com/news/2017/04/26/college-completion-rates-vary-race-and-ethnicity-report-finds.
US Bureau of Labor Statistics. 2015. “Frequently Asked Questions.” https://www.bls.gov/cps/faq.htm#Ques5.
Article

Article
Report

Article