Report
Assessing the First Year of Biden, in Graphs
Report
President Biden will deliver his first State of the Union address on Tuesday, March 1st. To take stock of the state of the union just over one year into the Biden presidency, CEPR presents this collection of articles and graphs. Despite the continued strain of the pandemic, the United States has experienced faster than expected recovery and growth. Most people in the US, including most working-class people, have higher wages and overall incomes—even after taking inflation into account—than before the pandemic.
These gains are largely due to federal policy decisions, including the American Rescue Plan Act of 2021, pandemic relief legislation passed in 2020, and executive actions. Further long-term gains will come from implementing the Infrastructure Investment and Jobs Act, signed by President Biden in November 2021, which includes major investments in rail and public transit, roads and bridges; water infrastructure; airports and ports, and access to high-speed internet.
At the same time, it is important to acknowledge that people have gone through a lot over the last several years. Even if they are doing as well or better in purely economic terms than before the pandemic, they may not feel it. Some important economic and social gains—including likely reductions in the uninsurance rate and income poverty in 2021—are fragile. They rest in part, on temporary policy changes that will, or already have, expired. Moreover, simply returning to, or modestly improving on, pre-pandemic baselines will leave much of the diverse US working-class in a precarious and insecure position and leave the existing care and climate crises largely unaddressed.
Given these economic uncertainties, the President needs to straightforwardly explain to the public how the economy is improving and what policies have contributed to the improvement. Then he needs to lay out a plan for building on the recent economic policy successes in a way that addresses the existing care and climate crises and reduces the economic and social inequalities that existed long before the pandemic.
When it comes to immigration and international relations, the Biden administration’s record so far is mixed. While many controversial Trump actions on immigration have been reversed others—including Title 42 expulsions, denounced by human rights groups—remain in place. In Biden’s first year alone, over 19,000 Haitian migrants have been returned to Haiti, more than under the last three presidents combined.
When it comes to economic sanctions, the Biden administration has generally maintained Trump’s policies, including far-reaching sanctions causing enormous human suffering in Venezuela, Cuba, and Iran. The most clear-cut improvement has been Biden’s strong support for a major allocation of IMF Special Drawing Rights, providing financial relief to developing countries at a critical time. However, despite strong appeals from lawmakers and developing governments, the US Treasury under Biden has so far opposed any reform to the IMF’s counterproductive and unfair surcharge policy.
Pandemics are rare events. From an economic perspective, it may be fair to say that the COVID-19 pandemic has created a type of economic recession that is not merely rare but unique. Never before have we had such a deadly and widespread pandemic with such a high level of global economic integration. These factors have come together to provide a very sharp and powerful shock to the US and global economy. While the shock is severe, the US is on the path to recovery.
It is important to note that this recovery is facing several headwinds. The US and other nations have seen the development of new and more infectious strains of the virus which prompted partial economic shutdowns. The pandemic has disrupted supply chains which slows the economic recovery. Conservatives have fostered opposition to the public health measures that can reduce the spread of the virus and speed the economic recovery. These factors have put a drag on the economic recovery, but the figures below show that the US economy is still bouncing back.
Boosted by the American Recovery Act, the US economy grew by 5.5 percent from the fourth quarter of 2020 to the fourth quarter of 2021. Thanks to the rapid growth in 2021, the United States is the only wealthy country that is back to its pre-pandemic growth path. As Figure 1 shows, real GDP for the United States was 2.1 percent higher in 2021 than in 2019, while the remaining G7 countries had yet to fully recover.
Figure 1
Figure 2 shows that the growth in employment, while not as fast as immediately after the official end of the COVID-19 recession, has continued over President Biden’s first year. The rate of growth is significantly stronger now than it was in a similar phase after the Great Recession.
Figure 2
Increases in the employment-to-population ratio (EPOP) or employment rate for all racial groups are illustrated in Figure 3. From January 2021 to January 2022, the white population had a 2 percentage point increase in their rate of employment. The Hispanic population has seen a 3.8 percentage point increase. People of color have had stronger growth in employment which helps to compensate for their greater rate of job loss during the recession.
Figure 3
Figure 4
The relatively strong growth in employment for people of color does not mean equal outcomes in employment. Figure 4 shows the prime-age employment rates by race. By focusing on the prime-age population, this figure compares populations that are more similar in their age distribution for more of an apples-to-apples comparison. Since these data are not seasonally adjusted and have more random fluctuations, the data used are quarterly data for better estimates. In Figure 4, the fourth quarter of 2021 shows the Black population had the lowest employment rate and the white population the highest.
The unemployment rate shows a similar picture as the employment rate. Figure 5 shows a stronger decline in unemployment over the first year of the Biden administration than over a comparable time period during the Great Recession.
Figure 5
Figure 6 shows the decline in the unemployment rate over the past year for all racial groups is larger than over the comparison period after the Great Recession. Hispanics, American Indians, and Asians have seen their unemployment rates decline 3 or more percentage points. The unemployment rate has declined more rapidly for people of color, but it also rose more rapidly for these groups over the recession.
Figure 6
Racial inequality in unemployment rates persists in the recovery. Figure 7 shows that the Black unemployment rate continues to be twice the white unemployment rate. We will need more than an economic recovery to eliminate racial inequality in the labor market.
Figure 7
While current payroll employment is still down by around 2.0 percent from pre-pandemic levels, unincorporated self-employment in the fourth quarter of 2021 was about 5 percent higher than in the fourth quarter of 2019 (Figure 8). While self-employment can often be an act of desperation for people unable to find regular employment, it can also mean that people are pursuing long-planned ventures.
Figure 8
As the unemployment rate has fallen to historically low levels, it seems likely that the rise in self-employment is mostly by choice. People who lost their jobs in the pandemic also were provided with some seed money with the various checks sent out over the course of the last two years ($1,200 per person in 2020 and $2,000 in 2021). This meant that many workers may have had the time and the resources to start a business.
Most small businesses fail, and this will likely be the case with many of the businesses that people have started in the last two years. However, some will succeed, and in any case, people were given the opportunity to try.
Employment in some key sectors remains far below pre-pandemic levels. As Figure 9 below shows, employment in local government has lagged behind both private employment and state government employment.
Employment in nursing care facilities is about 15 percent below its pre-pandemic level and only stopped falling in the latter half of 2021. Employment in the childcare sector is about 12 percent below its pre-pandemic level. By comparison, employment in food services and drinking establishments, one of the hardest hit sectors in the early months of the pandemic, is about 7 percent below its pre-pandemic level.
Figure 9
The pandemic complicates the measure of real wage growth (the extent to which wages rise more than prices) in two ways. In 2020, when the pandemic caused unemployment to soar, many lower paid workers lost their jobs. This raised the average wage of those still working. In 2021 this composition effect was reversed, as lower paid workers got their jobs back, lowering average wages.
There was also a pandemic price effect. The plunge in demand worldwide caused the price of many items, most notably gasoline, to fall. With the world economy bouncing back in 2021, the price of these items jumped back to their pre-pandemic level and often higher. The drop in prices in 2020 raised real wage growth in that year, while the bounce back in 2021 lowered it.
It makes sense to look at the two years together for these reasons. As can be seen in Figure 10, workers saw substantial real wage growth over this period, with the fastest growth in low-paying industries like restaurants and convenience stores. While coming out ahead over the two years of the pandemic, the wages of many higher paid workers did not keep up with inflation in 2021. However, workers in the lowest paying industries continued to see their pay outpace inflation.
Figure 10
Along these same lines, economist Arin Dube has found that employees in roughly the bottom two-thirds of the wage distribution have higher wages today, after taking inflation into account, than before the pandemic. Economists Thomas Blanchet, Emmanuel Saez, and Gabriel Zucman, have found that factor income—combined income from labor and capital markets—in the fourth quarter of 2021 was higher, even after taking inflation into account than in the last quarter of 2019.
Contrary to what many have claimed, wage growth is clearly not the main factor driving inflation over the last two years. There actually has been a large shift in income from wages to profits, meaning that corporations are raising prices by a larger amount than the increase in wages. Rising corporate profits, rather than higher wages, are the more important factor driving inflation at this point.
Most Americans had more income available to spend on goods and services in 2021, even after taking higher prices into account, than they did before the pandemic. In 2020, factor income (labor and capital market income) fell across the board, with people in the bottom half of the income distribution experiencing the largest declines. In the second half of 2021, factor income for the bottom half had recovered to its early 2019 level, and by the end of the year was 5 percent higher than in January 2019.
As seen in Figure 11, disposable income, available income after taking transfers and taxes into account, increased for most groups in 2020 and 2021 compared to 2019, with the increase being stronger in 2021. The increases in disposable income for working-class people in both years were due to the COVID-19 relief legislation passed during this period.
Figure 11
The United States lacks a consistent set of measures that reflect the income needed to not live in poverty today. However, there is little question that income poverty and most forms of material deprivation declined in 2021, particularly among households with children. Figure 12, below, shows monthly income poverty rates in 2020 and 2021. On average in the last quarter of 2021, about 12.7 percent of people in the US had very low incomes, compared to 16.1 percent in the last quarter of 2020. The decline was even larger for children.
Figure 12
The monthly poverty estimates used to create Figure 12 are not directly comparable with the annual poverty estimates published by the Census Bureau. According to the Census Bureau, the annual poverty rate fell by 2.6 percentage points between 2019 and 2020. Census will not release its 2021 annual poverty estimates until September, but given the considerable decline in monthly poverty between 2020 and 2021, there is little question that annual poverty was lower in 2021 than in both 2019 and 2020.
That said, most of the decline in monthly poverty in 2021 was driven by the one-year expansion of the Child Tax Credit in the American Rescue Plan, roughly half of which was paid in advance on a monthly basis between July 2021 and December 2021 (the remaining half will be paid as a lump sum to families in the first half of 2022 after they file their 2021 tax returns). Unless the expanded Child Tax Credit is extended, as President Biden has called for, poverty will increase in the second half of 2022.
Food insecurity also declined across the board between 2020 and 2021 (see Figure 13, below), with particularly large declines for Black and Hispanic households. Although the food insecurity estimates in this figure (from the Census Bureau’s Household Pulse Survey) are not directly comparable with available food insecurity estimates for 2019 (from the December Current Population Survey (CPS) Food Security Supplement), it seems likely that food insecurity is now below pre-pandemic levels. As measured by the CPS Food Security Supplement, there was no change in food insecurity between 2019 and 2020. CPS Food Security estimates for 2021 will not be released until September 2022. However, if the CPS trend mirrors the 2020–2021 trend in the Household Pulse Survey, then food insecurity would be lower in 2021 than in 2019.
Figure 13
Housing insecurity declined across the board between 2020 and 2021 (Figure 14, below). Among all US renters, the percentage who reported having “no” or “only slight” confidence in their ability to pay next month’s rent was 3.4 percentage points lower, on average, in 2021 than April–December 2020. Among all homeowners with a mortgage, the percentage who lacked confidence in their ability to pay next month’s mortgage declined by 2.8 percentage points over the same period. At the same time, substantial shares of renters and homeowners remain worried about making future housing payments, and ethnic and racial disparities in housing insecurity remain. Hispanic and Black adults are about twice as likely as white adults to be housing insecure.
Figure 14
There was an increase in the number of occupied housing units between the fourth quarter of 2019 and the fourth quarter of 2021 of 3,478,000 units, an increase of 2.8 percent, (Figure 15, below) which far outpaces population growth over this period. The reasons for the rapid increase in the number of occupied units is a rapid pace of construction in 2020 and 2021 and a sharp decline in vacancy rates. While many people face higher rents, the country is almost certainly much better housed today than before the pandemic. Securing affordable housing for low- and moderate-income families will be a major problem going forward.
Figure 15
Despite the pandemic recession, the percentage of non-elderly adults without health insurance was about the same (roughly 12.6 percent) in March 2021 as in March 2019. During this period, a 0.8 percentage-point decline in private coverage (employer-based and individual) was offset by an increase in public coverage, particularly Medicaid coverage. Coverage data through the end of 2021 isn’t available yet, but early quarterly estimates from the National Health Insurance Survey (NHIS) and administrative data from the Department of Health and Human Services (HHS) suggest that the uninsurance rate has dropped below its pre-pandemic level.
As Figure 16 below shows, point estimates of uninsurance among non-elderly people have trended downward through the 3rd quarter of 2021, with the most notable reductions among low-income people.
Figure 16
Small sample sizes for these preliminary estimates mean they have wide and overlapping confidence intervals. But when considered alongside administrative data showing a sharp increase in the number of Americans obtaining coverage through Affordable Care Act (ACA) insurance marketplaces and Medicaid, there is good reason to believe that there has been a real decrease in uninsurance rates.
Over the last year, a record number of Americans have obtained health coverage through ACA insurance marketplaces (Figure 17). The 2022 marketplace Open Enrollment Period (OEP) saw the highest number of enrollees since the passage of the ACA, with 14.5 million either starting or continuing marketplace coverage between November 2021 and January 2022. Prior to this, over 2.5 million signed up for new coverage through HealthCare.gov and state marketplaces during the extended Special Enrollment Period (SEP) between February and August 2021. The average number of insurance issuers participating in individual health insurance marketplaces has also ticked up. It is now at the highest number recorded since the marketplaces were established.
Figure 17
These increases are largely due to the American Rescue Plan Act (ARPA), which expanded eligibility for marketplace insurance subsidies and increased financial assistance for people who were already eligible for subsidies. The legislation also ensured that Americans who were receiving unemployment insurance had access to zero-cost plans. Both average monthly benchmark premiums and median individual deductibles have decreased substantially. However, it remains to be seen whether these gains will be short-lived. Key provisions in the ARPA that enabled coverage expansion and increased affordability are set to expire in 2022.
The Biden administration has already fulfilled many of President Biden’s ACA-related campaign promises, though it has yet to make good on his pledge to establish a public health insurance option. Despite recent progress, our largely for-profit health insurance system continues to leave millions uninsured or otherwise hesitant to access care due to cost concerns. The Medicare for All Act of 2021 would establish a single-payer system and ensure universal coverage. Such legislation would reorient incentives to prioritize patient and public health rather than corporate profits. It could also have positive spillover effects, including new business and job creation and increases in wages and job quality. While the Biden administration has made admirable progress on this issue, it is vital for them to champion more ambitious policies to truly reform health care in this country.
The Trump administration’s anti-immigration policy stance was high-profile, extremely controversial, and almost exclusively carried out through executive actions. The Biden administration’s immigration policy has been less overtly anti-immigrant and lower profile. Biden introduced a comprehensive immigration reform plan on his first day in office. But Biden’s immigration policy, like Trump’s, has been carried out through executive action. According to the Migration Policy Institute, the Biden administration took 296 executive actions on immigration through January 19, 2022, compared to 86 during the first year of the Trump administration.
Some of Biden’s actions have reversed early controversial Trump actions and returned the United States to a more welcoming stance in areas like family-based immigration, Temporary Protected Status and other humanitarian immigration, and the treatment of undocumented immigrants. According to preliminary data, Immigration and Customs Enforcement (ICE) “removed” 55,590 immigrants from the United States in 2021, compared to 185,884 in 2020 and 267,258 in 2019.
At the same time, some infamous Trump immigration policies have continued under the Biden administration. Late last year, the Fifth Circuit of the US Court of Appeals blocked the Biden administration’s attempt to end a Trump program that forced asylum seekers at the border to “remain in Mexico” where they are vulnerable to assault, kidnapping, and other violence — while their claims are considered. The Supreme Court is expected to issue a final decision in the case later this year.
The Biden administration has left in place the Trump administration’s “Title 42” expulsion policy, which cites COVID-19 concerns as a rationale to illegally expel asylum seekers. The continuation of Title 42 is a significant factor in the reduction of ICE “removals” mentioned above, since they are counted separately. More than one million individuals were expelled under Title 42 in 2021 (Figure 18). Such expulsions are up more than 35 percent so far in fiscal year 2022.
Figure 18
Haitian migrants have been particularly hard-hit over the last year. Although the Biden administration provided Temporary Protected Status to Haitians who were already in the United States as of July 29, 2021, it has also returned more than 19,000 Haitian migrants since taking office, nearly as many as under the three previous presidents between 2000 and 2020.
Biden’s comprehensive immigration reform, which the House passed in 2021 as part of the Build Back Better Act, is unlikely to pass the Senate this year. The majority of undocumented workers are “essential” or “frontline” workers. Even before the pandemic, they were making substantial contributions to the US economy, including paying payroll, income, and other taxes. Without comprehensive immigration reform, few have a path toward regularizing their status.
Although it has received little attention in the media, one of the most important forms of economic support that developing countries have received during the pandemic is an infusion of Special Drawing Rights (SDRs) from the International Monetary Fund (IMF). SDRs are international reserve assets — comparable to an international currency — that the IMF distributes to its 189 member countries in quantities roughly proportional to the size of their economies. In times of economic distress, countries can use these assets to bolster their international reserves — thereby helping to resolve balance of payments difficulties — or can convert them to hard currency and use them for public spending, for purchasing imports, or for covering debt service payments.
In the spring of 2020, when it became clear that the COVID-19 pandemic would cause enormous economic damage, particularly to developing countries, a number of economists (including CEPR economists), development experts, and even IMF Managing Director Kristalina Georgieva advocated for a major issuance of SDRs. Though the vast majority of IMF Board members supported this proposal, the Trump administration blocked it, thanks to the US government’s veto power over SDR-related decisions.
To its credit, the Biden administration reversed course and, in August 2021, joined the rest of the IMF Board in supporting an issuance of $650 billion worth of SDRs, the biggest such allocation in SDR history. Forty percent of these assets were distributed to developing nations, the majority of which have already used all or some of their SDRs, e.g., to invest in social programs, or to pay off debt to the IMF. Advanced economies that do not need SDRs are currently discussing mechanisms to rechannel these resources to low- and middle-income countries. However, it appears that the primary mechanisms being considered would generate more debt for developing countries and would come with burdensome conditionalities.
While the $650 billion allocation has provided significant relief worldwide, many more SDRs are needed to help developing countries address the ongoing economic and public health fallout of the pandemic. Fifty-four countries are currently facing debt crises. This is why dozens of humanitarian, faith-based, anti-debt, and anti-poverty groups have called for a total allocation of $3 trillion worth of SDRs. Nobel Economics laureate Joseph Stiglitz and the Prime Minister of Barbados have called for regular annual issuances of SDRs. Meanwhile, members of the US Senate and House of Representatives support an additional issuance of $2 trillion worth of SDRs; legislation supporting such an issuance has already been approved by the House of Representatives.
Figure 19
Figure 19 above shows how many SDRs (in dollars) have been issued under the Biden administration, and how many more civil society groups and US members of Congress are asking for.
As CEPR has pointed out, SDR issuances also help boost US export industries, which provide millions of jobs in the US. Will the Biden administration act on the urgent appeals of lawmakers and humanitarian groups and support another issuance of SDRs later this year?
As the pandemic rattled economies around the world, many countries sought debt relief or assistance from international financial institutions like the International Monetary Fund (IMF). Others sought to improve their economic situation with Special Drawing Rights. One issue overlooked at the beginning of the pandemic is the impact of IMF surcharges on vulnerable countries.
Surcharges are additional payments on top of regular interest payments and other fees. Countries are subject to surcharges if their IMF debt exceeds a certain level, or if they have three or more years of outstanding debt at the IMF. Surcharges can add up to 300 basis points to the interest rates for loans if both the time and size thresholds are reached. This means an interest rate of roughly 1 percent can balloon to 4 percent due to surcharges.
The additional amounts paid due to surcharges can be significant. The IMF projects that over $4 billion in surcharges will be paid from the start of the pandemic through the end of 2022. These payments, which are on top of standard interest and fees, are especially challenging for countries in crisis. Ukraine — which has experienced increased capital flight and currency depreciation due to tensions with Russia in early 2022 — paid $35 million in surcharges in February and was expected to pay $29 million in March. These challenges will likely get worse with the Russian military invasion. Argentina can expect to pay more than $5 billion in surcharges by the end of 2024, including about $1.1 billion in surcharges in 2022 — 70 percent of total payments to the IMF. Pakistan and Egypt also face very large surcharge payments.
Developing countries, international development experts, and US members of Congress are calling for the IMF to consider abandoning surcharges, or at least to suspend them while the policy undergoes a review. However, the US Treasury, which has enormous influence at the IMF, has so far opposed any reform to surcharge policy.
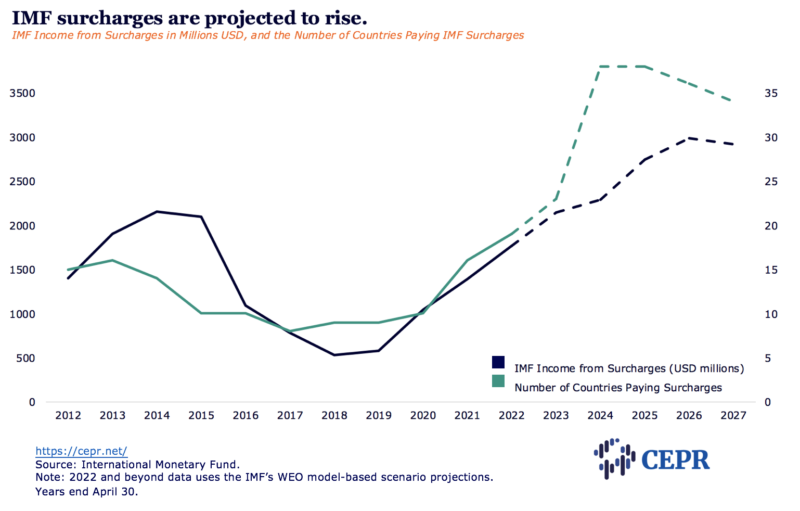
Figure 20 shows the amount of surcharge income paid to the IMF since 2012 by fiscal year, as well as projections from the IMF into the future. Historically, surcharges peaked in the mid-2010s (2013 for the number of countries, 16, and 2014 for income, nearly $2.2 billion) — most likely due to the effects of the Great Recession — before declining into the late-2010s. In fiscal year 2022, 19 countries will pay about $1.8 billion in surcharges. Throughout the remainder of President Biden’s term, the number of crisis-ridden countries paying surcharges is expected to grow significantly, resulting in substantial profits for the Fund. The IMF projects that the number of countries paying surcharges will peak at 38 in 2024 and 2025, while the income from surcharges will peak in 2026 at nearly $3 billion. These dramatic increases are likely due to the economic effects of the COVID-19 pandemic.
Ending surcharges would provide much-needed financial relief to a number of countries facing severe economic difficulties. If President Biden is serious about ensuring a more robust worldwide recovery from the pandemic, he could direct the US Treasury to support an end to IMF surcharges ahead of the IMF spring meetings in April.
Figure 20
Under the Trump administration, US military spending reached one of its highest levels since World War II in real (inflation-adjusted) terms. Under President Biden, little has changed. Despite the end of the US occupation of Afghanistan, the first military budget authorization passed under the Biden administration was roughly equal in real terms to the biggest military budget under Trump. The United States now spends more on its military than China, India, Russia, the United Kingdom, Saudi Arabia, Germany, France, Japan, South Korea, Italy, and Australia combined, and significantly more as a percentage of GDP than what is spent by any other G7 country.
At $768 billion, the fiscal year 2022 military budget is more than twice the annual cost of the much-debated and ultimately stalled Build Back Better Act, and more than 15 times the OECD estimate of the cost of vaccinating the entire world against COVID-19. Though this excessive spending is often justified as a job creator, every dollar spent on war making creates a fraction of the number of jobs made by investing in clean energy, health care, or education. According to the National Priorities Project, a mere 10 percent of annual Pentagon spending could instead pay for: 1 million clean energy jobs; 1 million elementary school teachers; 22 billion N95 respirator masks; or 8.5 million public housing units for one year.
Despite promises to rein in US foreign military deployments, and despite popular support and growing congressional pressure for cutting the Pentagon budget, ever-increasing Pentagon spending continues to receive strong bipartisan support in Congress. This is fueled in no small part by the influence of a powerful Pentagon contracting industry. Recent reports indicate that the Biden administration plans to request over $770 billion for military spending in fiscal year 2023, as indicated in Figure 21.
Figure 21
As a presidential candidate, Joe Biden promised that he would end the Saudi war on Yemen. He promised it during the primary, and again during the general election. He promised it in the Democratic Platform, which was agreed to by the Joe Biden and Bernie Sanders presidential campaigns, and which was approved by the delegates to the Democratic National Convention. As president, Biden renewed his promise to end the war a year ago in his “America is back, diplomacy is back” speech at the State Department. “This war must end,” President Biden said. A year later, he has not fulfilled his promise. The Saudi war on Yemen continues, the Saudi blockade on Yemen continues, and unconstitutional US participation in the war continues. Every Democratic member of Congress cosigned President Biden’s promise when the DNC delegates, which includes all the Democratic Members of Congress, ratified the Democratic Platform. Democratic members of Congress can and should uphold Biden’s promise by introducing and passing a Yemen War Powers Resolution to end the war.
Economic sanctions have become an increasingly popular foreign policy tool for US presidents and policymakers who wish to achieve regime change in targeted countries or force foreign adversaries to change their behavior without having to resort to military intervention. Rarely do supporters of sanctions acknowledge the dire economic and humanitarian impact of these measures that UN experts have characterized as “collective punishment,” although there are occasional moments of candor. For instance, Mike Pompeo, while secretary of state, said “things are much worse for the Iranian people” because of sanctions. More recently, Biden’s defense secretary, Lloyd Austin, stated that massive sanctions against Russia, when imposed, would “bring about a lot of pain and suffering” for ordinary Russians.
Since Secretary Austin’s remarks, the Biden administration has announced a new round of sanctions against Russia in response to Russia’s actions in Ukraine, including sanctions on the country’s central bank. As economists like Gabriel Zucman have noted, broad economic sanctions of this sort inflict significant suffering on ordinary Russians while having little impact on the country’s elites.
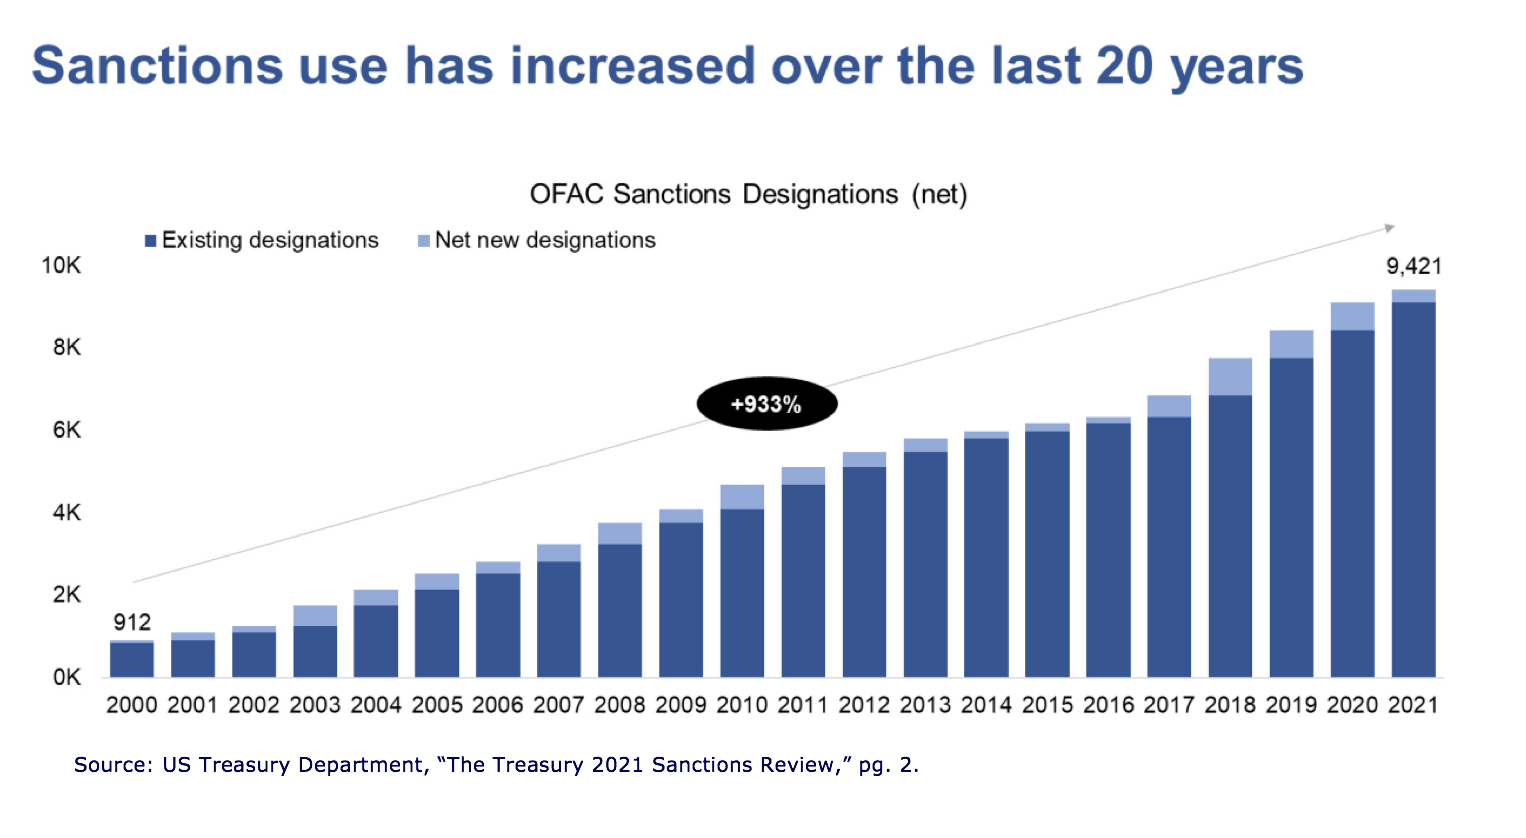
While the use of sanctions by the US has increased enormously over the last 20 years, the Trump administration was notably zealous in deploying crippling economic sanctions, particularly against Venezuela, where they played a central role in the country’s economic collapse and have contributed to tens of thousands of avoidable deaths. Human Rights Watch observed US economic sanctions against Iran caused widespread shortages of essential medicines and supplies, with especially dire consequences for the most vulnerable. In Cuba, the Trump administration reversed Obama’s easing of the US embargo and imposed new secondary sanctions against foreign companies and banks doing business in Cuba.
As nearly all of Trump’s sanctions were enacted by executive order rather than through congressional legislation, many hoped that President Biden would quickly repeal Trump’s most egregious sanctions with the stroke of a pen. Global leaders such as the UN Secretary General, the European Union foreign policy chief, and Pope Francis called for an easing of sanctions to allow targeted countries to better address the fallout of the COVID-19 pandemic. On his first day in office, Biden announced that the US Treasury and other agencies would “promptly review” US economic sanctions to “evaluate whether they are unduly hindering responses to the COVID-19 pandemic,” prompting expectations of a major course correction. But the Sanctions Review that Treasury released 10 months later was as light on content (a mere seven pages) as it was on substance, with no acknowledgment of the dire humanitarian impact of many US sanctions and a set of recommendations that were, as the American Prospect put it, “so vague and generic they approach meaninglessness.”
Treasury’s review does, however, include a handy graph showing the dramatic increase in the number of US sanctions over the last two decades. A copy of this graph can be found in Figure 22.
Even aside from Russia, far from easing up on sanctions use, Biden has continued to impose Trump’s crushing sanctions against Venezuela, Cuba, and Iran, and has been roundly criticized for doing so by dozens of progressive members of Congress. By August, Biden had succeeded in surpassing Trump’s grim sanctions legacy by waging economic warfare against Afghanistan (which we examine in the next section).
Figure 22
In August 2021, the last contingents of US troops were evacuated from Afghanistan, and the Taliban quickly took over the country’s government institutions in Kabul. With the end of conventional ground warfare, the Biden administration quickly turned to economic warfare, freezing roughly $7 billion in Afghan central bank assets held in the United States (Figure 23). To a fragile economy highly dependent on foreign aid and imports, the freezing of the Central Bank’s foreign reserves has triggered a rapid economic collapse. The resulting humanitarian crisis now threatens to take the lives of more civilians than were killed in 20 years of war.
The UN Development Programme predicts that by the middle of this year, fully 97 percent of Afghanistan’s population will be living in poverty. In the coming months, 23 million people, more than half of the entire population, are predicted to face acute food insecurity. Over one million children under the age of five are at risk of dying from lack of food. Already, there are reports of Afghans forced to choose between purchasing food and fuel to heat their homes. Others are selling their organs and even children to survive.
President Biden’s recent decision to set aside half of these seized reserves for compensation for victims of the September 11 attacks, for which the Afghan people bear no responsibility, and to use the rest for humanitarian assistance that will do little to mitigate the devastating effects of the country’s economic collapse, makes the situation worse. Only the return of the full amount of frozen funds to the Central Bank, which is the rightful owner, will create the necessary liquidity to backstop and ultimately reverse this economic freefall.
Figure 23
The unequal distribution of vaccines in the world has exacerbated inequality between wealthy and poorer countries during the COVID-19 pandemic. In March 2021, the World Health Organization (WHO) referred to the situation as “vaccine apartheid,” and though the situation has improved to some degree since then, glaring disparities persist. The unequal distribution of vaccines globally has resulted in avoidable suffering and death and has also created other social and economic challenges.
The Biden administration could have, and could still, do far more to help improve developing nations’ access to vaccines.
Figure 24
Figure 24 shows the amount of vaccines the Biden administration has promised to donate but which have yet to be delivered, the vaccines, delivered bilaterally, and those delivered via COVID-19 Vaccines Global Access, or COVAX, an initiative of the WHO. The United States has delivered less than 40 percent of the vaccines it has promised to the world.
The reality is worse than the figure above suggests. Some vaccines donated by the United States and other rich countries were close to expiry or had expired and could not be used. In addition, the United States initially hoarded vaccines for domestic use, but facing resistance to vaccination, ended up throwing out millions of doses that could have otherwise been transferred to countries around the world. The TRIPS waiver at the World Trade Organization first proposed in 2020 would have permitted poorer countries to manufacture vaccines domestically by suspending intellectual property protections. While the Biden administration eventually supported a TRIPS waiver, it has allowed the issue to stagnate, knowing that other countries would block its implementation.
The Biden administration should recommit to a TRIPS waiver at the WTO as civil society has demanded and use diplomatic pressure to ensure that it is implemented in short order, as it does for a variety of other issues the US government supports. As part of this, the United States should require companies like Moderna, which developed vaccines and other treatments for coronaviruses with public funding, to share their recipes and manufacturing processes to ensure these sorts of initiatives are supported in other areas of the government and not impeded by conflicts of interest. If this had been done as vaccines were being developed in spring 2020, millions, if not tens or hundreds of millions more people around the world would have been vaccinated.
It is shameful that despite being in office for over a year, the Biden administration has not yet acted in any significant way to ensure that mRNA vaccines are available globally. In the meantime, Dr. Peter Hotez, Dr. Maria Elena Bottazzi, and their team at Baylor University have done what the Biden administration has been unwilling to compel companies like Pfizer and Moderna to do: freely share the know-how required to make their effective, patent-free COVID-19 vaccines with others around the world. The United States should use the Baylor team’s vaccine and the universal COVID-19 vaccine being developed at Walter Reed National Military Medical Center as models for how public, open-source vaccines could be shared with the world.
Lastly, given that US vaccine makers can not currently meet global demand, the Biden administration should recognize and encourage the distribution of effective vaccines from other countries, including countries deemed to be global “adversaries.” This includes treatments developed in Cuba, China, and Russia that are often ignored, lobbied against, or actively hampered by US sanctions. It makes little sense to oppose these treatments when there is a significant risk of new variants emerging in any part of the world where the virus can spread in an uncontrolled manner.
Article

Report

Article

Report