States of the Unions: The ‘Where’ of the US Labor Movement
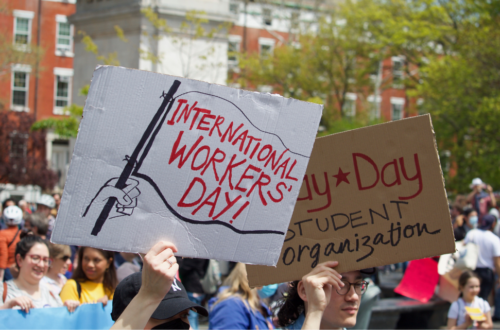
In 2023, the share of US workers who were members of a union continued to hover at 10 percent. The union membership rate in the public sector (32.5 percent) was more than five times the rate in the private sector (6.0 percent). However, these summary membership statistics conceal substantial geographic variation in US union membership density. As workers around the world celebrate May Day this week, it is worth reflecting on how the labor movement is performing in different parts of the US.
Figure 1 shows the overall union membership density in 2023 in each of the US states and the District of Columbia. Overall membership rates ranged from 24.1 percent in Hawaii to 2.3 percent in South Carolina. Hawaii’s union membership rate first supplanted New York’s in 2018, and Hawaii has held onto the top spot ever since. There is also a strong regional component. Union membership density is consistently higher throughout the northeast and northwest than it is in the southeast or southwest.
Figure 1
Union membership has continued to decline during the pandemic. However, just over 40 percent of states and the District of Columbia saw net increases in union membership density between 2019 and 2023. Figure 2 shows the percentage point change in union membership between 2019 and 2023 in each of the US states and the District of Columbia. The largest overall share increases took place in Vermont (up 3.1 percentage points), followed by Connecticut and Tennessee (both up 1.4 percentage points), Montana (up 1.3 percentage points), and Iowa (up 0.9 percentage points). Rhode Island sustained the biggest overall loss in density (down 5.1 percentage points), followed by Maine (down 2.6 percentage points), Washington and Alaska (both down 2.3 percentage points), and Nevada (down 2.2 percentage points).
Figure 2
In 2023, Connecticut had the highest public sector union density in the US at 67 percent, while South Carolina had the lowest at 5.7 percent (Figure 3). Public sector union membership density is also concentrated in the northeast and northwest, with far sparser unionization in the southwest and southeast.
Figure 3
The public sector has experienced substantial declines in union membership during the pandemic, even in states with strong traditions in public sector unionism (Figure 4). Between 2019 and 2023, the largest increase in union membership took place in Kentucky (up 6.0 percentage points), followed by Georgia and Vermont (both up 4.9 percentage points ), Utah (up 4.4 percentage points), and Connecticut (up 4.3 percentage points). The most substantial declines in public sector union membership were in Rhode Island (down 15.2 percentage points), followed by Maine (down 8.4 percentage points), Maryland (down 7.2 percentage points), Florida (down 6.1 percentage points), and Michigan (down 5.9 percentage points).
The declines in public sector union membership have come amid a steady downturn in state and local government employment since the Great Recession. While the US response to the pandemic’s economic crisis was more robust than its response to the Great Recession, the damage done by the latter has shown impressive staying power. Chronic underfunding made a large chunk of the public sector much less resilient to subsequent crises, resulting in further sacrifice of quality union jobs.
Union membership in the private sector mirrored overall union membership in 2023: Hawaii claimed the top spot with a private sector union density of 15.2 percent, while South Carolina came in last with a private sector union density of just 1.6 percent (Figure 5). States with so-called “right-to-work” laws—which require unions to represent nonmembers for free — tended to have lower union density than states without such laws, in keeping with the regional patterns in the public sector and overall.
Figure 5
Between 2019 and 2023, the largest increase in private sector union membership occurred in Vermont (up 2.9 percentage points), followed by New Jersey (up 2.0 percentage points), Mississippi (up 1.6 percentage points), and Montana (up 1.5 percentage points) (Figure 6). The biggest drops in private sector union membership density took place in Nevada and Rhode Island (both down 2.2 percentage points), Wyoming (down 2.1 percentage points), Washington (down 2.0 percentage points), and Alabama (down 1.9 percentage points).
Figure 6
There is substantial diversity in union membership rates by state or territory and by region. Yet even accounting for this wide diversity, union membership in the US lags behind its international peers. The state with the highest union membership density, Hawaii, still had a lower union membership rate than every Canadian province except Alberta. To some extent, this is the result of widespread anti-worker norms and policy choices.
Nevertheless, there are meaningful geographical differences in the organizing environment and the extent and enforcement of worker protections in the US. These differences mean that starting and keeping unions is much easier in some parts of the US than in others. The labor movement has made it clear that they are unwilling to concede large swathes of the country to an anti-worker status quo, however. New efforts to organize the South appear to be picking up steam, most recently with the triumph of the United Auto Workers in the union election at Volkswagen’s plant in Chattanooga, Tennessee. However, it remains to be seen if these efforts and others will continue to be successful at the scale necessary to reverse decades of decline.