Article • Dean Baker’s Beat the Press
Back in the 1990s, whining about the impending disaster from the retirement of baby boomer cohorts was all the rage. Private equity billionaire Peter Peterson’s polemics were big sellers, as very serious people struggled with how we could deal with this tidal wave of retirees. The basic story was that a rising ratio of retirees to workers would create a crushing burden for the younger people that were still in the labor force.
This argument went somewhat out of style over time. In part, the projection of exploding healthcare costs that drove the horror story turned out not to happen. Back in 2000, the long-term projections showed that healthcare would account for roughly one-third of total consumption spending by now. In fact, actual healthcare spending is less than 25.0 percent of total consumption. The difference between the 2000 projection and actual healthcare spending leaves about $1.5 trillion on the table (around $12k per family, each year) for us to spend on other things.
The second reason this demographic horror story went out of style was the slow recovery from the Great Recession. It took us over a decade to return to full employment following the collapse of the housing bubble. The problem for the economy in this decade was not that spending was too high, but rather that it was too low. (This is known as the “which way is up?” problem in economics.) If we had larger deficits during the last decade it would have provided a boost to growth and led to less unemployment.
Finally, the impending retirement of the baby boomers was no longer impending as they began to retire in the last decade. At the start of the decade the oldest baby boomers were already age 64. By 2020, the oldest baby boomers were age 74 and the youngest were already age 56. A substantial portion of the baby boom generation was already retired and the world had not ended.
The Return of the Demographic Crisis
But, as they say in Washington, no bad idea ever stays dead for long. In recent months the demographic crisis from retiring baby boomers seems to be everywhere. The major news outlets are filled with piece after piece telling us that we are running out of workers, at least when they are not telling us how the spread of robots and AI will create mass unemployment. (Yes, those claims are contradictory, but don’t tell any elite intellectual type.)
Anyhow, the basic story of the aging crisis is that workers will have to turn over a large portion of their paycheck to cover the costs of a growing population of retirees. This concern is supposed to lead us to cut Social Security and Medicare benefits and tell workers that they have to work later in life.
There are a couple of important points to be made at the start of any serious discussion. First, we have already raised the age at which people are eligible for full Social Security benefits. It had been 65 for people born before 1940. It has been gradually raised to 67 for people born after 1960. So, we have already taken account of people’s increased longevity in setting the parameters for Social Security.
The second point is that the gains in life expectancy have not been evenly shared. For people born in 1930 the gap in life expectancy, at age 50, between the top income quintile and the bottom income quintile for men was 5.0 years, and for women was 3.9 years. For the cohort born in 1960, the gap had increased to 12.7 years for men and 13.6 years for women. This means that almost all the gains in life expectancy over the last half century have been for those at the top of the income ladder. Those further down have seen little or no gains in life expectancy.
Next, it is important to have some idea of the dimensions of the aging “crisis.” We all know about the widely touted projected shortfalls in Social Security and Medicare. Let’s imagine that we made them up by raising the payroll tax. (That’s not the best way to deal with the problem, but this is just a hypothetical exercise.)
Suppose we raised the payroll tax by 4.0 percentage points tomorrow. Given current projections, this would be roughly enough to make the Social Security and Medicare trust funds solvent forever.
The graph below shows the current annual wage for a person getting the median wage, working full-time full year (50 weeks at 40 hours a week). It also shows what this worker would be getting if the median wage had kept pace with productivity growth, as it did in the long post-war boom from 1947 to 1973. And, it shows what this pay would have been if, in this scenario, we increased the payroll tax by 4.0 percentage points.[1]
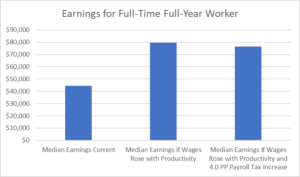
Source: Economic Policy Institute, BEA, BLS, and author’s calculations.
Given the current median wage of just over $24 an hour, the full-year pay, net of payroll taxes (7.65 percent on the worker’s side) would be just under $46,600. By contrast, if their pay had kept pace with productivity growth over the last half-century, it would be over $79,700 net of payroll taxes.
If we said that it was necessary to raise the payroll tax by 4.0 percentage points (half on the employer and half on the employee) to deal with the cost of supporting an aging population, then the annual wage would fall to $76,500.[2] That would still be more than 70 percent above its current level.
The reality is that most workers stand to lose an order of magnitude more income due to upward redistribution than what they could conceivably risk from the changing demographics of the country. If we think that an aging population poses a risk to the living standards of younger workers, then upward redistribution is a disaster.
The Causes of Inequality
The hawkers of the demographic crisis story seem to want us to believe that inequality just happened and we just have to live with it. Of course, that is a lie. Inequality was the result of deliberate policy choices. We could have pursued different policies that would have not led to the rise in inequality we have seen over the last half century.
My book, Rigged, goes through the story in more detail, but I will quickly outline the basic picture. First, we have redistributed a massive amount of income upward with longer and stronger patent and copyright monopolies and related protections. Bill Gates would likely still be working for a living (actually, he could be collecting Social Security) if the government didn’t threaten to imprison people who made copies of Microsoft software without his permission.
It is common for economists to claim that technology was a major factor in upward redistribution. That is not true, it was our rules on technology that drove the upward redistribution. There are other, arguably more efficient, mechanisms for supporting innovation and creative work. These would likely not lead to as much inequality.
We also have pursued a narrow path of globalization where we quite deliberately put our manufacturing workers in direct competition with low-paid workers in the developing world. This had the predicted and actual effect of lowering the wages of manufacturing workers and non-college-educated workers more generally.
At the same time, we maintained or even increased the protections for highly educated professionals, like doctors and dentists. As a result, our doctors earn twice as much as doctors in other wealthy countries.
If we didn’t want to increase inequality, we could have pursued a course of globalization that focused foremost on reducing the barriers that protected our most highly paid workers. But these professionals, unlike manufacturing workers, have enough political power to ensure that trade deals will not be structured in ways that threaten their livelihood.
Our financial sector is a cesspool of waste and corruption. An efficient financial sector is a small financial sector. Instead of pursuing policies to promote efficiency, we have pursued policies that have encouraged bloat in this sector, which is the source of many of the biggest fortunes in the country.
When the market would have massively downsized the financial industry in the financial crisis, leaders of both political parties could not move quickly enough to rush to its rescue. There were no market fundamentalists when the great fortunes in the industry were in jeopardy.
We have also structured rules on corporate governance in ways that allow CEOs to rip off the companies they work for. The corporate directors, who are ostensibly charged with making sure CEOs and top management aren’t overpaid, for the most part, don’t even see this as part of their job description.
The bloated pay for CEOs warps the pay structure more generally. When a CEO can get $30 million and third-tier execs can get $2-$3 million, it creates a situation where even heads of charities and universities can command multi-million dollar paychecks.
High unemployment has also been a tool for lowering the pay of the typical worker. The only times where the pay of the median worker has outpaced inflation in the last half century have been when the unemployment rate was close to or below 4.0 percent.
The fact that anti-trust policy has been little used in the last four decades has likely also played a role in the recent shift from wages to profits. It will be interesting to see if the more aggressive policies pursued by the Biden administration have any effect in this area.
In short, we have made a series of policy decisions that have led to a massive upward redistribution of income in the last half-century. The impact of this upward redistribution on the income of young workers dwarfs the impact of demographics. Unfortunately, our news outlets seem more interested in highlighting the demographic issue than the causes of inequality.
There is one final point. We absolutely should be spending more money on daycare, healthcare for pregnant women and young children, early childhood education, and a variety of other areas that would benefit the young. However, there is no reason to believe that spending on the elderly is the obstacle preventing more spending in these areas.
[1] The median wage is taken from the Economic Policy Institute’s State of Working America data library. The 2022 was adjusted for the increase in the personal consumption expenditure deflator from 2022 to September of 2023 to get current dollars. Productivity growth since 1973 was adjusted for differences in deflators and the distinction between net and gross income, as well as the declining wage share of compensation to get the 2023 wage figure.
[2] Much of the projected shortfall in Social Security is a direct result of the upward redistribution of income since a larger share of wage income falls over the cap on taxable wage income (currently $186,600), as well as the shift from wages to profits in the last two decades.