Article
The Social Security Disability Trust Fund Has Gotten Healthier: Have Workers?
Article
(The authors would like to thank Kathy Rufflng and Kathleen Romig who provided very helpful comments on an earlier version of this paper. For a more detailed analysis of the Social Security Disability Insurance program see the Center on Budget and Policy Priority’s Chart Book.)
In the first decade and a half of this century, there was considerable concern about the Social Security Disability Insurance (DI) program. Many politicians and policy types argued that people were abusing the program, which was being manipulated by many healthy people to fake disability to get DI rather than work. This reduced the size of the workforce and strained the finances of the program. The annual trustees’ report showed the date of the trust fund’s exhaustion moving continually closer. By 2015, it was projected to be just one year away from exhaustion.
The program’s finances improved substantially the next year and have continued to improve in subsequent years. The most recent report projects the date of the Trust Fund’s depletion as 2057. The improvement in finances is due to a lower rate of allowances and, since 2010, fewer people applying. We trace this pattern in the discussion below.
Figure 1 below shows the projected date of the DI trust fund’s exhaustion from the annual Trustees’ Reports.
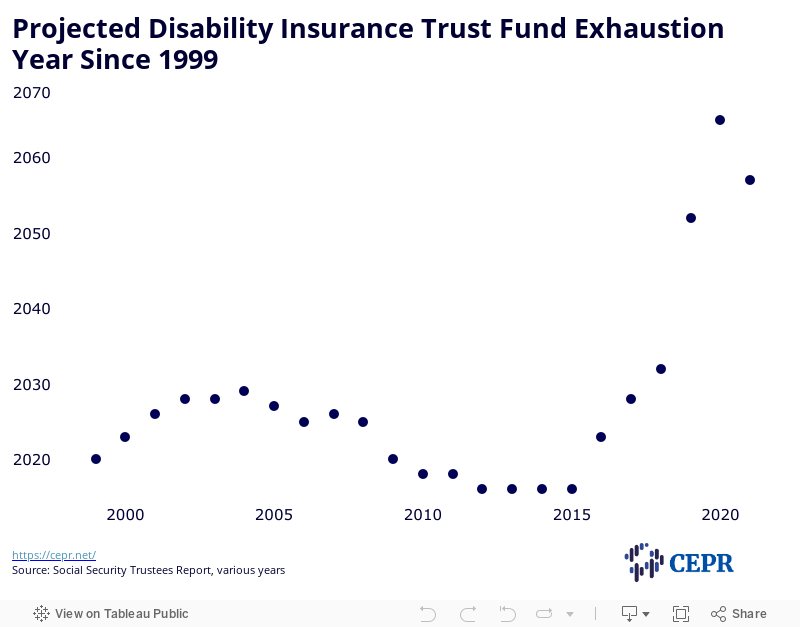
As shown in Figure 1, the projected date of DI fund exhaustion moved steadily closer after 2004, when it was at 2029. By 2015 the exhaustion date was just a year away, at 2016, raising serious concerns that the program would be unable to pay out full benefits to beneficiaries in the very near future. Over the past five years, however, we have seen the financial health of the DI fund improve greatly. The date of projected exhaustion in the 2020 report was 2065.
Figure 2 shows the total number of individuals receiving disability benefits, as well as annual awards, denials, and applications pending final decision. The total number of applications trends downward in the last five years, reflecting the combined trend of both awards and denials.
Figure 2
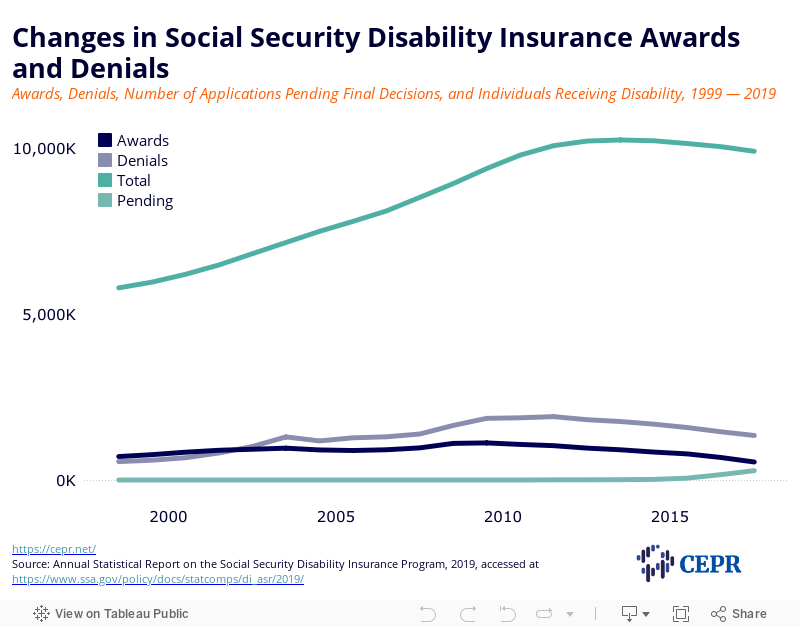
The number of people receiving benefits rose rapidly through the decade from 2000 to 2010. The rate of increase then slowed, eventually peaking in 2013. It then edged down slightly, even as the size of the working-age population continued to grow. The reason for this pattern is easy to see. The annual number of denials have risen sharply, first exceeding awards in 2003, and continuing to rise relative to approvals until 2012. Both approvals and denials have declined in subsequent years, as fewer people applied for benefits.
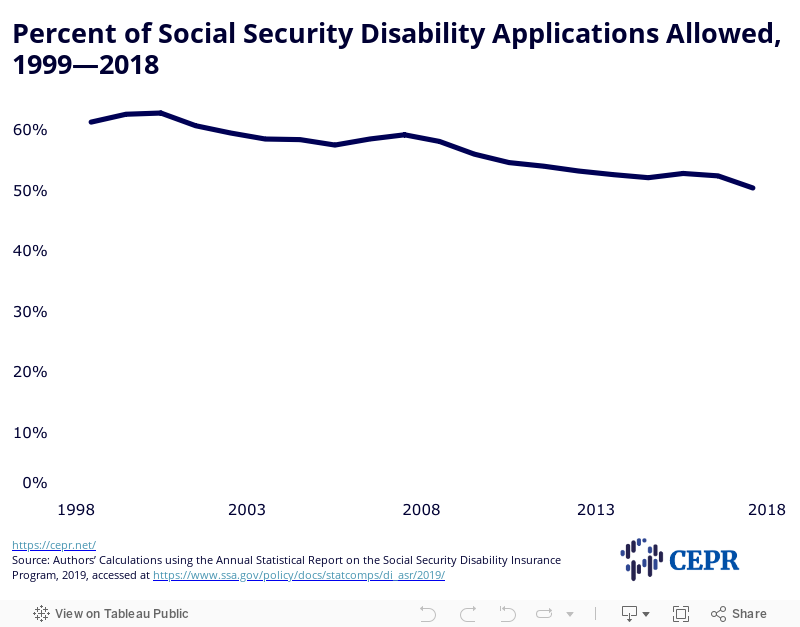
Figure 3 shows the percent of disability claims which are allowed. This excludes applicants that were turned down for technical reasons, such as having earnings that are too high to qualify or not having enough quarters of work to be eligible for benefits. As can be seen, the allowance rate declines from slightly over 60 percent in 1999 to just over 50 percent in 2018. This decline in allowance rates was likely a factor in the drop in applications. When workers came to think that it was less likely that an application would be approved, many may have decided that there was little point in applying for benefits.
Figure 3
A drop in both application and allowance rates has led to a substantial improvement in the financial health of the Disability Insurance Trust Fund. The basic story here is that many fewer people are now getting disability benefits than the trustees had projected in the first half of the last decade.
In 2015, the Trustees projected (Table V.C5) that there would be 9,470,000 workers getting disability benefits in 2020. The 2020 report (Table V.C5) projected that there would be just 8,292,000 workers receiving benefits at the end of the calendar year, a decline of 12.4 percent. The projections for a smaller number of workers receiving disability continues for later years. The 2015 report projected that 9,974,000 workers would be receiving benefits in 2030 and 10,550,000 in 2040. These numbers fell to 8,429,000 for 2030 and 9,108,000 for 2040, in the 2020 Trustees’ report.
The current projections assume that the recent trends in applications and allowances continue. The assumed incidence rate (the percent of eligible workers newly being awarded benefits in a year) going forward was assumed to be 5.4 per thousand workers in the 2015 Trustees’ report, reflecting recent experience. The incidence rate assumed for future years in the 2020 report was just 5.0 percent, reflecting the sharp drop in the allowance rate in the prior five years. The lower allowance rate over these five years, coupled with the assumption that this pattern would continue, adding several decades to the projected date at which the DI trust fund will be exhausted.
Why We Care
The increased difficulty in obtaining disability benefits does save the program money, but potentially at a human cost, as many people who are genuinely disabled and unable to work may not be receiving the benefits to which they are entitled.
In short, the financial health of the Disability Insurance Fund has improved, but individuals may be suffering due to an inability to receive the benefits they need to support themselves. The point of the program is, of course, to provide income to people who are unable to work because of disabilities. If people who are in fact disabled are too discouraged to apply or are being denied benefits, then the program is not performing the function for which it was designed.