

November 15, 2012

I’m not kidding, that’s the headline of a blog post:
“this graph should scare you.”
The Post reports on a new study from the Congressional Budget Office (CBO) which shows that GDP growth in this recovery has been considerably weaker than the average of prior recoveries. It’s not entirely clear why the graph from CBO is supposed to be scary. After all, don’t most people already know the economy stinks?
And the reason is pretty simple, we don’t have any source of demand to replace the $1 trillion or so of annual construction and consumption demand that was generated by the housing bubble. So CBO’s graph doesn’t seem to be giving us any new information.
Perhaps we are supposed to be scared by CBO’s assessment that two-thirds of the reason for slower growth is slower potential GDP growth, with only one-third is due to slower demand growth. This could be seen as somewhat scar. After all, if the economy really has much less growth potential that would be bad news, but on closer inspection there is not much “there” there.
Half of CBO’s estimated slowing of potential GDP growth is due to slower labor force growth. This is the story of the retirement of the baby boom cohorts. As a baby boomer who one day expects to retire, this never struck me as especially scary and it certainly is not news. Everyone other than former Senator Alan Simpson (who seems to have first discovered the baby boom cohort when he sat on President Obama’s deficit commission) knew that we would have a big wave of baby boomer retirements about 50 years ago.
We have two stories here. One is slower population growth. This pays us all sorts of dividends in reduced crowding and less pollution which are mostly not picked up in GDP measures. While some folks around this town (Washington) go nuts over slower population growth or, even worse, declining populations, I consider this outcome as 100 percent positive. (It is not good if people who want children feel that they are unable to afford them.)
The other story is a rising ratio of dependents (retired and young) to workers. This is somewhat of a drag on living standards, but hardly a disaster. The graph below shows the projected negative impact on after-tax wages of the increase in the ratio of retirees to workers compared with the positive impact of various rates of productivity growth.
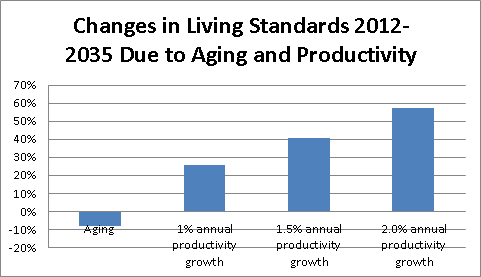
Source: Social Security Trustees Report and author’s calculations.
Are you scared yet?
Okay, the demographic portion of CBO’s calculation may not be especially new or scary, but what about the remaining third of the total gap that is due to other factors? It turns out that half of this hole is due to less capital. In other words, because companies invested less in new plant and equipment in the last five years than they did in the pre-recession period, productivity growth increased less than would otherwise have been the case.
That really shouldn’t scare us too much. One of the main determinants of investment is demand growth. In other words, if we had done something to maintain demand (e.g. big stimulus program, lower trade deficit etc.), we would have seen more investment. Therefore we would not have seen the slowing of potential GDP due to a slower rate of capital accumulation.
If we can calm ourselves about the drop in investment, this leaves the remaining sixth of the gap. This one is due to slower multifactor productivity growth. That is amount of growth that is attributable to better technology or the better organization of the production processes.
There are two points to be made here. The first is that measures of multifactor productivity growth are horrible. The reason is that it is a residual. We look at GDP growth, calculate the amount that can be explained by increased labor and capital and then attribute the difference to multifactor productivity growth.
Over the last decade, measured multifactor productivity growth has averaged just over 1.0 percent annually. Suppose that when we get our revised data for GDP we discover that growth has been revised up by an average of 0.2 percentage points, a not especially large revision. This would boost our measure of multifactor productivity growth by 0.2 percentage points, or 20 percent.
Can this happen? It is certainly possible. Will it? We’ll see when get the revisions to GDP data, which may even go the other way. The point is that this measure is extremely erratic and it would be silly to get too worried about a modest fall or rise over a relatively short period of time.
The other point is that even if the drop in the pace of multifactor productivity growth proves to be real, it would have had only one third of the impact on economic growth in this cycle as the drop in demand. (I have flipped the lost productivity growth due to slower investment to the demand side.) This would still mean it should be some cause for concern (hey, who wouldn’t like more mulitfactor productivity growth?) but makes it considerably less important than generating the demand needed to bring the economy back to full employment.
For these reasons, CBO’s story of slower potential GDP growth doesn’t scare me. The fact that we lack the political will to take the steps needed to bring the economy back to full employment does.


Comments