Article • Dean Baker’s Beat the Press
Her column is headlined “Obamacare is Unable to Save Money on U.S. Health Care.” The heading then goes on to explain how some of the cost-saving provisions in the Affordable Care Act (ACA) have not led to cost savings.
The reason why this is so striking is that healthcare costs in the United States have risen much less rapidly since the passage of the ACA than had been projected by the Congressional Budget Office or the Centers for Medicare and Medicaid Services. Healthcare spending has risen only modestly as a share of GDP since 2010, and in the last few years it has actually fallen slightly.
Here’s the picture through last fall.[1] (Someone may want to update this, but I have other things to do just now.)
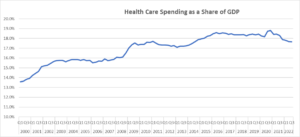
Source: Bureau of Economics Analysis and author’s calculations.
I realize that the slowing in health care costs can not all be attributed to Obamacare, but I would make two points here. First, if healthcare costs had gone the other way, and risen more rapidly than projected, we know that Obamacare would be blamed, even if the factors leading to higher costs had absolutely nothing to do with the ACA. That is absolutely 100 percent without question. In the interests of symmetry, we should give the ACA credit for the sharp slowing in healthcare cost growth.
The other point is a simple logical one. Whatever the reason for the slowing of health care cost growth, it has provided the country with an enormous economic dividend.
CBO’s long-term budget projections from 2009, the year before the ACA passed, showed that healthcare spending would be equal to 33.1 percent of total consumption spending by 2022 (Table F2-2). In fact, my calculations (adjusted for the 0.8 percentage point gap with CMS), show healthcare spending at just 24.8 percent of current consumption spending.
The gap between the 33.1 percent of consumption projection from CBO and 24.8 percent actual, is equal to more than $1.45 trillion on an annual basis. This comes to $11,800 per family each year. Compared to the projected path of growth of health care spending from 13 years ago, an average family has an additional $11,800 a year to spend on items other than health care.
This is a big deal that really should be more widely recognized. It doesn’t help to have a columnist in one of the country’s most important newspapers claiming the exact opposite of the reality.
[1] These numbers are slightly higher than what the Centers for Medicare and Medicare Services (CMS) report for healthcare spending as a share of GDP. They showed a figure of 17.6 percent for 2019 (the last year for which data are available), while my calculations come to 18.4 percent. I assume this is due to some double counting, where I may have some government healthcare spending, which also shows up as consumption. For those wanting to check, I added lines 64, 119, 170, and 273 from NIPA Table 2.4.5U and line 32 from NIPA Table 3.12U. These are therapeutic equipment, pharmaceuticals and other medical products, health care services, and net health care insurance. Line 32 is the government spending on Medicaid and other healthcare provision. Although the level is somewhat higher than the CMS data indicate presumably the changes over this period follow the changes as measured by CMS reasonably closely.