

October 29, 2012

The Post had an interesting idea that went badly awry. It thought to tell its readers what parts of the economy are lagging by comparing the share of GDP in the most recent quarter to the average over the period from 1985 to 2005. While the choice of years is somewhat problematic (in the years 1996-2000 the economy was being supported by an unsustainable stock bubble and in the years 2002-2005 by an unsustainable housing bubble), the bigger problems stem from a failure of arithmetic and also conceptualization.
On the arithmetic front, the piece comes up with a story where consumption of durables is $267 billion below the long-term average, while consumption of non-durables are $127 billion below their long-term average. While it has consumption of services somewhat about the long-term average, the next effect is that weak consumption is a big drag on the economy and accounts for a large share of the shortfall. It tells us:
“Consumers are holding onto their wallets — a continuing burden for the weak economy.”
Wow, that isn’t what the Commerce Department is telling my spreadsheet. I get that the average share of consumption (all categories together) in GDP was 67.3 percent in the years from 1985 to 2005. I get that it was 70.8 percent in the most recent quarter. This means that consumption was 3.5 percent higher than its longer period average as a share of GDP. This means that consumers are not hanging onto their wallets at all. In fact, they are spending at very ambitious rate. (Boys and girls, you can check this one for yourself by going to the National Income and Product Accounts and clicking up Table 1.1.5.)
This is consistent with the data showing that consumption is higher than normal relative to disposable income. (The adjusted consumption line has to do with the treatment of the statistical discrepancy in the national income accounts.) This means that consumption is not holding back the economy, it is actually unusually high.
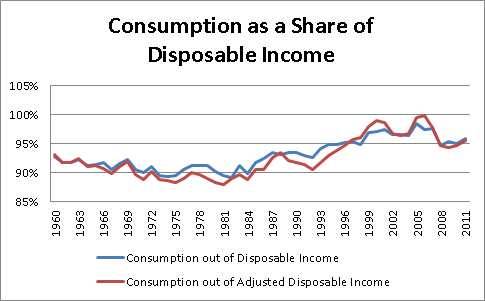
Source: Bureau of Economic Analysis.
The amount of excess consumption is even more than this comparison suggests, since one reason that consumption is high relative to GDP is that tax revenue is low relative to GDP (i.e. we are running large budget deficits). If the deficit starts to come down, then disposable income will fall relative to GDP, which means that consumption will fall relative to GDP, even if the saving rate stays constant.
The other error along these lines is that imports should be expected to rise relative to GDP as the economy moves back toward its potential. If GDP were to rise by 6 percent to bring it back in line with its potential then imports would rise by roughly 20 percent as much or 1.2 percentage points of GDP. This would make it more clear that the biggest factor that is out of line with our historical experience is the trade deficit. That would be even more clear if we took a longer period as the basis of comparison that was not so distorted by asset bubbles.
Of course given the Washington Post’s unabashed celebration of recent trade agreements its reporters are probably not allowed to call attention to such facts.


Comments