Article
Last year, President Obama called for increasing the federal minimum wage to $10.10 an hour by the end of 2015. He argued that after 2015, increases in the minimum wage should be tied to inflation, with the minimum wage rising in line with the consumer price index.
The purchasing power of the minimum wage peaked in the late 1960s at $9.54 an hour in 2014 dollars. That is over two dollars above the current level of $7.25 an hour. While raising the minimum wage to $9.54 would provide a large improvement in living standards for millions of workers who are currently paid at or near the minimum wage, it is worth asking a slightly different question: what if the minimum wage had kept in step with productivity growth over the last 44 years? In other words, rather than just keeping purchasing power constant at the 1968 level, suppose that our lowest paid workers shared evenly in the economic growth over the intervening years.
This should not seem like a far-fetched idea. In the years from 1947 to 1969, the minimum wage actually did keep pace with productivity growth. (This is probably also true for the decade from when the federal minimum wage was first established in 1938 to 1947, but we don’t have good data on productivity for this period.)
As the graph below shows, the minimum wage generally was increased in step with productivity over these years. This led to a 170 percent increase in the real value of the minimum wage from 1948 to 1968. If this pattern of wage increases for those at the bottom was supposed to stifle growth, the economy didn’t get the message. Growth averaged 4.0 percent annually from 1947 to 1969 and the unemployment rate for the year 1969 averaged less than 4.0 percent.
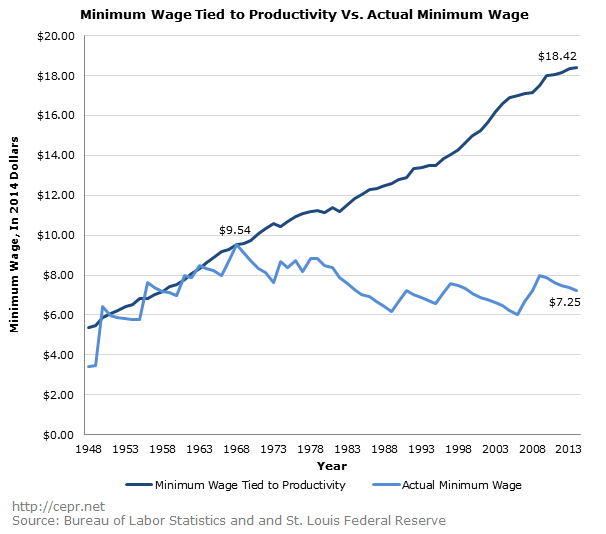
This link between productivity and the minimum wage ended with the 1970s. During that decade the minimum wage roughly kept pace with inflation, meaning that its purchasing power changed little over the course of the decade. The real value of the minimum wage then fell sharply in the 1980s as we went most of the decade without any increase in the nominal value of the wage, allowing it to be eroded by inflation. Since the early 1990s the real value of the minimum wage has roughly stayed constant, which means that it has fallen further behind productivity growth.
How was it decided to break the link between productivity growth and the minimum wage? It’s not as though we had a major national debate and it was decided that low-wage workers did not deserve to share in the benefits of economic growth. This was a major policy shift that was put in place with little, if any, public debate.
If the minimum wage had kept pace with productivity growth it would be $18.42 in 2014 dollars. It is important to note that this is a very conservative measure of productivity growth. Rather than taking the conventional data published by the Bureau of Labor Statistics for the non-farm business sector, it uses the broader measure for economy-wide productivity.* This lowers average annual growth by 0.2–0.3 percentage points.
This measure also includes an adjustment for net rather than gross output, and it uses a CPI deflator rather than a GDP deflator, which further lowers the measure of productivity growth.** Even with making these adjustments, the $18.42 minimum wage would exceed 2014’s median hourly wage of $17.09. We would have a very different society if all workers were earning a wage above this productivity-linked minimum wage.
Does this mean that the minimum wage should be increased to $18.42? Not necessarily. Just because an $18.42 minimum wage was doable in 1968 does not mean it is possible in today’s economy. We have had a low federal minimum wage for a long period of time. Much of the economy is dependent on jobs that pay much less than $18.42. In fact, this is above the median hourly wage for 2014, meaning most workers earn less than this amount.
While there is a considerable body of research showing little or no employment impact from increases in the minimum wage, these studies look at much smaller increases than the 150 percent increase implied by an $18.42 minimum wage. It is not possible to extrapolate from these studies to assess the effects of a minimum wage hike that is far beyond their range.
Nonetheless it is interesting to see how much higher the minimum wage would be today if we had continued to follow the practice of the forties, fifties, and sixties. We would have a very different country if our lowest paid workers were earning $37,000 a year.
*If we just used non-farm productivity as the basis for indexing the minimum wage, the most commonly used measure of productivity, the minimum wage would have been $21.75 in 2012 (see here).
**These adjustments are explained in Baker, 2007. For the years since 2006, we assumed that the difference in the growth rate of non-farm productivity and the growth of this adjusted measure is the same as it was on average for the years 2000–2006.