


I’ve complained a lot about how the major media outlets seem to highlight every piece of bad news about the economy, while downplaying or ignoring altogether the positives. Given my complaints, I want to offer a word of praise.
Last night, NPR ran two pieces highlighting programs that make a big difference in people’s lives. One was a piece that talked about the growing number of people who are getting healthcare insurance through exchanges created by Obamacare. The Biden administration made the subsidies for moderate and middle-income people considerably more generous. As a result, many people can now get insurance for little or no money. This has led millions of people to enroll in the exchanges for the first time.
The second piece was on a person with student debt who had just had his remaining balance forgiven after twenty years on an income-based repayment plan. The Biden administration has made the income-driven repayment plan far more generous. As a result, moderate and middle-income people with student loan debt will pay little or nothing. They also shortened the repayment period so that some people will have their balances written off after a decade.
It is great that NPR noted these programs, not just because they showed positive things the Biden administration has accomplished, but also because there are millions of people who could benefit from these programs, but don’t realize it. By publicizing them NPR is performing a valuable public service.
Read More Leer más Join the discussion Participa en la discusión
It increasingly looks like the Fed and the Biden administration have nailed the notoriously difficult soft landing, with inflation rapidly falling towards the Fed’s 2.0 percent target and the unemployment rate still under 4.0 percent. All the signs are that the economy will continue to grow and create jobs at a healthy pace in 2024 and that inflation will remain moderate for the foreseeable future.
With near-term economic prospects looking pretty damn good, we can be sure that the deficit hawks will soon be coming out of the woodwork. We can count on being regaled with talk of unprecedented levels of debt and deficits. We will hear of the need for cutting Social Security and Medicare, or cries for the creation of another deficit commission, which is the backdoor way of cutting Social Security and Medicare.
Since we all know what’s coming, we should arm ourselves with knowledge of tax farming. You’re probably wondering what tax farming is, and what it has to do with our current debt and deficit situation. In an odd way, it can tell us a great deal about how we should think about our deficits and especially our debt.
Tax farming was the practice of selling off the right to collect a specific tax. It was a common practice in pre-revolutionary France and in many other countries in prior centuries. The idea was that the government set a tax, say a customs duty on the goods that came through a specific port, and then sold off the right to collect the tax to a specific person. This gave the government an immediate infusion of cash, although it meant that it did not have access to the future revenue from the tax.
We actually still have similar practices. For example, back in 2008, Chicago’s then-mayor, Richard M. Daley, sold off the right to collect revenue from city parking meters for the next 75 years for $1.16 billion. This gave Daley money to pay the bills in 2008 but cut off a stream of revenue to the city for the next seven and a half decades.
What is neat about the practice of tax farming is that the loss of revenue does not appear as debt on the ledgers. Obviously, if we are doing long-term projections of the city’s finances we would have to take account of the lost revenue stream, but the money the city got for selling the right to collect revenue from parking meters does not appear as a loan and adds to the city’s debt. Nor do the payments going to the parking meter company count as an expenditure by the city, as would be the case with interest on a loan, so they do not directly add to the deficit from that side.
If we were looking at the city of Chicago’s budget the way we typically look at the federal budget, selling off the revenue from the parking meters was an absolutely brilliant move. The city effectively got a $1.16 billion loan without adding to its debt. That means the people yelling about an exploding debt or rising debt-to-GDP ratios would have nothing to say on this one. The debt did not rise.
Similarly, we don’t have to pay interest on this loan. That means when we are complaining about the rising interest burden, and how interest is becoming the largest item in the federal budget, we’re good with the parking meter deal. There are no interest payments here.
From Parking Meters to Government-Granted Patent Monopolies
I trust that even economists can understand how selling off the revenue from parking meters was effectively a loan to the city, but we managed to keep it off the books so that it doesn’t give deficit hawks anything to complain about. It turns out that government-granted patent and copyright monopolies are largely the same story.
At the most basic level, a patent monopoly or its cousin, copyright monopoly, is a way that the government pays people to do things. In the case of a patent monopoly, we are paying people to innovate. We tell them if they develop a new product or process, the government will give them a monopoly for a period of time, so that they can charge much more than the free market price. With copyrights, we are paying them to do creative work, like write a book, sing a song, or make a movie, or develop software. (Due to changes in the law in the 1990s, software is eligible for both patent and copyright protection.)
In this sense, these monopolies are different from the parking meter revenue sale, but in a way that should get the deficit hawks even more concerned. The parking meter revenue sale did not involve any direct economic activity, except for the relatively small number of people involved in negotiating the deal and transferring the money. It did not add $1.16 billion to GDP in 2008.
By contrast, patent and copyright monopolies actually do directly stimulate economic activity. We are giving out these monopolies precisely because we want people to spend time and money innovating and doing creative work. They do add to GDP.
This should matter a great deal to people worried about deficits. Remember, the problem with a large deficit is that it creates too much demand in the economy. The economy can’t produce enough to meet the demand being created by the deficit. This means that either we get inflation, or the Fed has to raise interest rates to reduce demand.
If government-granted patent and copyright monopolies are boosting demand, that should make us every bit as concerned as if the government was boosting demand with a large deficit. Incredibly, the deficit hawks literally never say a word about the demand created as a result of patent and copyright monopolies.
Patent and Copyright Monopolies and Government Debt
The value of these government-granted monopolies also doesn’t appear on the books as part of the government debt. This means, incredibly, that we could double the length of all patent and copyright monopolies (even retroactively to ones already granted, as we have done repeatedly with copyrights) and not add a dollar to the government debt.
The payments that result from these monopolies are similar to the payments made to the parking meter company or the tax farmers. They are effectively taxes imposed on the population, although they are not collected by the government.
And these taxes can be very large. In the case of prescription and non-prescription drugs alone, these implicit taxes likely cost us close to $500 billion a year, as we pay over $600 billion for drugs that would likely cost less than $100 billion if sold in a free market. That comes to over $4,000 a year for an average family. If we add in the higher costs for medical equipment, computers, software and a range of other items, we are almost certainly looking at implicit taxes of well over $1 trillion a year. In other words, real money.
If we think of how these implicit taxes affect the economy, it is similar to how the parking meter payments affect the economy of the city of Chicago. They amount to money pulled out of people’s pockets. That makes them less well off directly and also less able to bear the burden of other taxes.
In the case of prescription drugs, there is the additional issue that a large share of the patent rents are actually paid by the government. Roughly a third of drug spending directly comes from the federal government through Medicare, Medicaid and other government programs. Another 15 percent is paid by state and local governments.
This makes the deficit hawks’ decision to ignore patent and copyright monopolies all the more absurd. If the government borrowed another $120 billion a year to replace the patent-supported research done by the pharmaceutical industry, they would all be yelling and screaming about the big increase in the deficit. (This would be in addition to the more than $50 billion in annual research spending already supported by the National Institutes of Health and other government agencies.) But they would completely ignore the future savings from being able to buy drugs at the free market price rather than the patent-protected price. That may make sense in Washington, but not for anyone who actually cares about the future of the economy.
Government-Granted Patent and Copyright Monopolies Are Part of the Debt, or You’re Not Serious
The basic story here is that we have to recognize that granting patent and copyright monopolies is a way that the government pays for things. They are an alternative to direct spending. We have to recognize their economic impact if we want to do serious accounting of debts and deficits. The fact that their impact is almost universally ignored speaks to the seriousness of the current debate.
Read More Leer más Join the discussion Participa en la discusión
Since President Biden took office, the media have run a constant stream of news stories about how high various prices were and telling their audiences that this has led to mass suffering. These stories appear less frequently now, although we still hear Republican politicians and people posting on social media that they are paying $5 for a gallon of gas or $90 for a turkey.
It is impossible to know what specific people pay for an item. Who knows, some stores charge outrageous prices and maybe people purchased a specialty item rather than the standard fare version.
But, it’s not worth spending time on the anomalies. We do have good data on the averages from the Bureau of Labor Statistics (BLS), which puts a great deal of effort into tracking prices and rents around the country. I thought it would be worth just posting some of the price increases on key items since the pandemic and comparing them with wage increases for various groups of workers.
Source: Bureau of Labor Statistics and author’s calculations.
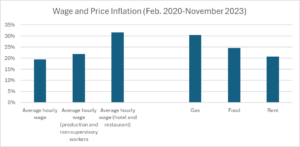
The graph above shows the increase in the average hourly wage since February of 2020 for all workers, for production and non-supervisory workers, and for production and non-supervisory workers in the hotel and restaurant industries. The average hourly wage for all workers increased 19.4 percent, for production and non-supervisory workers it increased 21.9 percent, and for workers in the hotel and restaurant industry it increased 31.6 percent.
There are a couple of points worth making here before comparing these increases to the price increases over this period. First, the 19.4 percent increase for all workers is a hair more than the 18.8 percent rise in the overall Consumer Price Index over this period, but clearly not a great picture. However, it is a better story than many periods in the past, like the 1980s, early 1990s, and 2000s, when wages were not keeping pace with prices.
It is also important to remember that we were hit with a worldwide pandemic during this period. The impact of the pandemic caused wages to fall behind prices in almost every other country. As some people may recall, we actually had rationing (anyone got toilet paper?) in 2020 at the start of the pandemic. So, coming out slightly ahead is not a bad picture when confronted with a natural disaster.
The other point is that, in contrast to the pattern for most of the last four decades, lower-paid workers are doing better now than higher-paid workers. The category of production and non-supervisory workers includes roughly 80 percent of the workforce force. It excludes managers and higher-paid professionals like doctors and lawyers. In the last three and half years, this group is doing better on average than the 20 percent at the top. This has substantially reduced the wage inequality we have seen develop since 1980.
This story is seen even more clearly with the 31.6 percent rise in the pay for production and non-supervisory workers in the hotel and restaurant industries. This is the lowest-paying major sector in the economy. The tight labor market has forced employers in this sector to cough up more money to get and keep the workers they need to run their businesses.
Okay, now for the comparisons. The 30.4 percent rise in gas prices would outpace the wage increases for most workers, but the workers in the hotel and restaurant industry still come out slightly ahead. It is worth noting that gas prices are hugely erratic.
Gas prices were relatively low at the start of the period and then were driven up by supply disruptions associated with the reopening from the pandemic (the Trump administration negotiated worldwide supply reductions during the pandemic) and then the Russian invasion of Ukraine. Prices have been falling sharply in recent months, as supply returned to normal (U.S. production is at a record high). The December prices are likely to be a few percentage points lower than the November data shown here, as prices are continuing to fall.
Food prices rose on average 24.7 percent since the pandemic. There were shortages of many items early in the pandemic. We expect shortages to lead to rising prices, but it seems that major manufacturers also took advantage of these shortages to jack up their profit margins. As the supply chain problems have been largely ended, profit margins are still elevated. This has caused most workers’ pay to lag somewhat behind food prices.
Here too it is worth noting that prices are hugely erratic. Since February, the price of store-bought food has increased at just a 0.7 percent annual rate. It is likely that wage increases will break even with food prices in the next year.
The third category shown is rents, which have risen on average by 20.7 percent. This is a bit more than the rate of wage growth for all workers, but more than a percentage point less than the increase for production and non-supervisory workers. It is more than 10.0 percentage points less than the wage growth seen by workers in the hotel and restaurant industries.
Here too there is a better story on the way. Rents shot up in 2021 as people working from home decided they needed more space and were prepared to spend some of the money they saved commuting to get themselves larger apartments or houses. This was a one-time effect.
While people are still working from home, the number is no longer surging. And much new housing is coming on line after pandemic disruptions limited supply in 2021-2022. The result is that rents have stabilized and in many areas are actually falling. The rent indexes in the CPI will lag the market, since they measure rents in all units, however we can already see the stabilization in the rents of units that turn over. This will show up in the CPI next year.
Source: Bureau of Labor Statistics and author’s calculations.
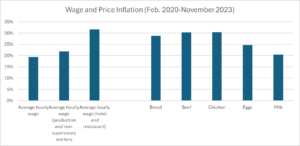
The graph above shows the prices of some of the food items that have been highlighted by the media when they rose rapidly earlier in the recovery. The price of bread has risen 28.8 percent since the pandemic, outpacing most workers’ wages, but not those of the low-paid workers in the hotel and restaurant industry. This was driven in part by a jump in wheat prices following Russia’s invasion of Ukraine, but wheat prices are now back to their pre-invasion level. This is an area where increased profit margins are likely a big deal.
The next item is beef, the price of which has risen by 30.3 percent. Here there is more of an explanation with the price of the underlying commodity, with wholesale prices having also risen by close to 30 percent. Interestingly, most of this rise was in 2020, when much of the economy was shut down.
Chicken prices have risen by 30.3 percent since the start of the pandemic, but this is also a case where good news is on the way. The big issue here was an Avian flu epidemic that devastated the chicken stock. This has more recently been brought under control. The stocks have been rebuilt and chicken prices have been flat over the last year.
Egg prices are largely the same story. They soared last year, capturing headlines and were highlighted in numerous news stories. In the last year, prices have plummeted, and egg prices are now up by 24.7 percent since the start of the pandemic. We can look forward to egg prices being stable or falling somewhat in the next year.
The last item is milk, which also captured headlines when its price rose rapidly in 2021 and 2022. This was likely driven largely by supply chain disruptions, as people were buying more milk in stores and less in restaurants. Milk prices have since stabilized and have fallen over the last year. They are now up by 20.4 percent since the start of the pandemic, somewhat more than the rise in wages for all workers, but slightly less than the increase for production and non-supervisory workers and more than 10.0 percentage points less than the wage increase for workers in the hotel and restaurant industries.
This is a very quick snapshot of some wage increases and the prices of some items that have featured prominently in news stories. There are many items whose price has risen far less than wages, like appliances, clothing, and college tuition. The prices of these items have not gotten much attention, but they are also part of people’s shopping basket.
Obviously, everything is not great in the economy, but most people are coming out ahead of inflation. With wages still growing at a healthy pace and inflation slowing, it looks like the picture will improve further in 2024, as we push the pandemic further into the past.
Productivity has grown at an extraordinary 4.4 percent annual rate in the last two quarters. That compares to an average of rate of just 1.1 percent in the decade prior to the pandemic. We expect wages to roughly keep pace with productivity. No one expects the 4.4 percent rate to continue, and the productivity data are highly erratic, but with the spread of AI and other new technologies, it is plausible that we are on a faster productivity growth path.
Also, if we can sustain a tight labor market (we’ve had 22 months of below 4.0 percent unemployment, the longest stretch in half a century), we should expect to see profit margins eroded, as income shifts back from profits to wages. In short, we look to be on a promising economic path, but bad things can always happen.
Since President Biden took office, the media have run a constant stream of news stories about how high various prices were and telling their audiences that this has led to mass suffering. These stories appear less frequently now, although we still hear Republican politicians and people posting on social media that they are paying $5 for a gallon of gas or $90 for a turkey.
It is impossible to know what specific people pay for an item. Who knows, some stores charge outrageous prices and maybe people purchased a specialty item rather than the standard fare version.
But, it’s not worth spending time on the anomalies. We do have good data on the averages from the Bureau of Labor Statistics (BLS), which puts a great deal of effort into tracking prices and rents around the country. I thought it would be worth just posting some of the price increases on key items since the pandemic and comparing them with wage increases for various groups of workers.
Source: Bureau of Labor Statistics and author’s calculations.
The graph above shows the increase in the average hourly wage since February of 2020 for all workers, for production and non-supervisory workers, and for production and non-supervisory workers in the hotel and restaurant industries. The average hourly wage for all workers increased 19.4 percent, for production and non-supervisory workers it increased 21.9 percent, and for workers in the hotel and restaurant industry it increased 31.6 percent.
There are a couple of points worth making here before comparing these increases to the price increases over this period. First, the 19.4 percent increase for all workers is a hair more than the 18.8 percent rise in the overall Consumer Price Index over this period, but clearly not a great picture. However, it is a better story than many periods in the past, like the 1980s, early 1990s, and 2000s, when wages were not keeping pace with prices.
It is also important to remember that we were hit with a worldwide pandemic during this period. The impact of the pandemic caused wages to fall behind prices in almost every other country. As some people may recall, we actually had rationing (anyone got toilet paper?) in 2020 at the start of the pandemic. So, coming out slightly ahead is not a bad picture when confronted with a natural disaster.
The other point is that, in contrast to the pattern for most of the last four decades, lower-paid workers are doing better now than higher-paid workers. The category of production and non-supervisory workers includes roughly 80 percent of the workforce force. It excludes managers and higher-paid professionals like doctors and lawyers. In the last three and half years, this group is doing better on average than the 20 percent at the top. This has substantially reduced the wage inequality we have seen develop since 1980.
This story is seen even more clearly with the 31.6 percent rise in the pay for production and non-supervisory workers in the hotel and restaurant industries. This is the lowest-paying major sector in the economy. The tight labor market has forced employers in this sector to cough up more money to get and keep the workers they need to run their businesses.
Okay, now for the comparisons. The 30.4 percent rise in gas prices would outpace the wage increases for most workers, but the workers in the hotel and restaurant industry still come out slightly ahead. It is worth noting that gas prices are hugely erratic.
Gas prices were relatively low at the start of the period and then were driven up by supply disruptions associated with the reopening from the pandemic (the Trump administration negotiated worldwide supply reductions during the pandemic) and then the Russian invasion of Ukraine. Prices have been falling sharply in recent months, as supply returned to normal (U.S. production is at a record high). The December prices are likely to be a few percentage points lower than the November data shown here, as prices are continuing to fall.
Food prices rose on average 24.7 percent since the pandemic. There were shortages of many items early in the pandemic. We expect shortages to lead to rising prices, but it seems that major manufacturers also took advantage of these shortages to jack up their profit margins. As the supply chain problems have been largely ended, profit margins are still elevated. This has caused most workers’ pay to lag somewhat behind food prices.
Here too it is worth noting that prices are hugely erratic. Since February, the price of store-bought food has increased at just a 0.7 percent annual rate. It is likely that wage increases will break even with food prices in the next year.
The third category shown is rents, which have risen on average by 20.7 percent. This is a bit more than the rate of wage growth for all workers, but more than a percentage point less than the increase for production and non-supervisory workers. It is more than 10.0 percentage points less than the wage growth seen by workers in the hotel and restaurant industries.
Here too there is a better story on the way. Rents shot up in 2021 as people working from home decided they needed more space and were prepared to spend some of the money they saved commuting to get themselves larger apartments or houses. This was a one-time effect.
While people are still working from home, the number is no longer surging. And much new housing is coming on line after pandemic disruptions limited supply in 2021-2022. The result is that rents have stabilized and in many areas are actually falling. The rent indexes in the CPI will lag the market, since they measure rents in all units, however we can already see the stabilization in the rents of units that turn over. This will show up in the CPI next year.
Source: Bureau of Labor Statistics and author’s calculations.
The graph above shows the prices of some of the food items that have been highlighted by the media when they rose rapidly earlier in the recovery. The price of bread has risen 28.8 percent since the pandemic, outpacing most workers’ wages, but not those of the low-paid workers in the hotel and restaurant industry. This was driven in part by a jump in wheat prices following Russia’s invasion of Ukraine, but wheat prices are now back to their pre-invasion level. This is an area where increased profit margins are likely a big deal.
The next item is beef, the price of which has risen by 30.3 percent. Here there is more of an explanation with the price of the underlying commodity, with wholesale prices having also risen by close to 30 percent. Interestingly, most of this rise was in 2020, when much of the economy was shut down.
Chicken prices have risen by 30.3 percent since the start of the pandemic, but this is also a case where good news is on the way. The big issue here was an Avian flu epidemic that devastated the chicken stock. This has more recently been brought under control. The stocks have been rebuilt and chicken prices have been flat over the last year.
Egg prices are largely the same story. They soared last year, capturing headlines and were highlighted in numerous news stories. In the last year, prices have plummeted, and egg prices are now up by 24.7 percent since the start of the pandemic. We can look forward to egg prices being stable or falling somewhat in the next year.
The last item is milk, which also captured headlines when its price rose rapidly in 2021 and 2022. This was likely driven largely by supply chain disruptions, as people were buying more milk in stores and less in restaurants. Milk prices have since stabilized and have fallen over the last year. They are now up by 20.4 percent since the start of the pandemic, somewhat more than the rise in wages for all workers, but slightly less than the increase for production and non-supervisory workers and more than 10.0 percentage points less than the wage increase for workers in the hotel and restaurant industries.
This is a very quick snapshot of some wage increases and the prices of some items that have featured prominently in news stories. There are many items whose price has risen far less than wages, like appliances, clothing, and college tuition. The prices of these items have not gotten much attention, but they are also part of people’s shopping basket.
Obviously, everything is not great in the economy, but most people are coming out ahead of inflation. With wages still growing at a healthy pace and inflation slowing, it looks like the picture will improve further in 2024, as we push the pandemic further into the past.
Productivity has grown at an extraordinary 4.4 percent annual rate in the last two quarters. That compares to an average of rate of just 1.1 percent in the decade prior to the pandemic. We expect wages to roughly keep pace with productivity. No one expects the 4.4 percent rate to continue, and the productivity data are highly erratic, but with the spread of AI and other new technologies, it is plausible that we are on a faster productivity growth path.
Also, if we can sustain a tight labor market (we’ve had 22 months of below 4.0 percent unemployment, the longest stretch in half a century), we should expect to see profit margins eroded, as income shifts back from profits to wages. In short, we look to be on a promising economic path, but bad things can always happen.
Read More Leer más Join the discussion Participa en la discusión
In keeping with its apparent commitment to ignore the data and insist homeownership is no longer possible, the New York Times ran yet another piece on how homeownership is becoming impossible for young people. The piece begins with the sad story of a young woman worried whether she and her spouse will ever be able to own a home.
“Cameron Ambrosy spent the first weekend of December going to 10 open houses — purely for research purposes. The 25-year-old in St. Paul, Minn., has a well-paying job and she and her husband are saving diligently, but she knows that it will be years before they can afford to buy.
“‘It is much more of a long-term goal than for my parents or my grandparents, or even my peers who are slightly older,’ said Ms. Ambrosy, adding that for many of her friends, homeownership is even farther away. ‘There’s a lot of nihilism around long-term goals like home buying.’”
It is unfortunate to hear about this nihilism. It would have been helpful to note that it does not correspond to the data. While homeownership rates have fallen back somewhat in the last few quarters, as a result of the sharp jump in mortgage rates, they are still above the pre-pandemic levels.
This is true across the board, including for young people. The graph below shows the homeownership rate for households under age 35.
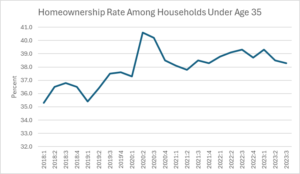
Source: Census Bureau, Table 6.
Note that in the most recent quarter, the homeownership rate for households under 35 was 38.3 percent, which is up from 37.6 percent in the fourth quarter of 2019, the last quarter before the pandemic.[1] That was when Donald Trump was still in the White House and the New York Times was not running article after article about how young people could not afford to buy houses.
Let me just repeat this point for the benefit of any elite types that might be reading this. The New York Times has repeatedly run pieces on the impossibility of homeownership for young people during the Biden administration. It did not run pieces on the impossibility of homeownership among young people when the homeownership rate was lower during the Trump administration.
Now, there is clearly an issue at the moment with high mortgage rates, but mortgage rates always fluctuate, and even the article notes that they have already fallen and are likely to fall further in the near future. It would be a bit bizarre for someone to have little hope of owning a home for long into the future based on a short-term rise in mortgage rates that is already being reversed.
If mortgage rates follow the 10-year Treasury bond rate downward, and the extraordinarily large gap between the 30-year mortgage rate and the 10-year Treasury bond rate is reduced, we may be looking at mortgage rates below 6.0 percent before long. That’s still somewhat higher than the pre-pandemic rate, but not high by historic standards.
The piece also talks about the runup in rents. This is undoubtedly a big deal for young people, since they are twice as likely to be renters as the rest of the population. However, it would be worth pointing out that rental inflation has pretty much stopped and rents may actually be falling.
Indexes of apartments that come on the market are now showing that rents have leveled off over the last half year. This slowdown in rental inflation will eventually show up in the government data, however, there is a lag, since the government rental indexes include all rental units, not just the ones that turn over. However, people actively looking for an apartment would be benefitting now from the lower inflation, or even falling rents.
It may well be the case that young people see a huge crisis in the housing market, but in that case the story should be how their perceptions are so much at odds with the reality, not an article that wrongly implies the reality is horrible.
[1] The big jump in ownership rates in 2020 was likely an artifact of the shutdown, when response rates to the survey plunged. (Correction: It has been pointed out to me that the 2020 rise was due to young people moving back in with their families during the pandemic. This reduced the number of households, raising the share who were homeowners.)
In keeping with its apparent commitment to ignore the data and insist homeownership is no longer possible, the New York Times ran yet another piece on how homeownership is becoming impossible for young people. The piece begins with the sad story of a young woman worried whether she and her spouse will ever be able to own a home.
“Cameron Ambrosy spent the first weekend of December going to 10 open houses — purely for research purposes. The 25-year-old in St. Paul, Minn., has a well-paying job and she and her husband are saving diligently, but she knows that it will be years before they can afford to buy.
“‘It is much more of a long-term goal than for my parents or my grandparents, or even my peers who are slightly older,’ said Ms. Ambrosy, adding that for many of her friends, homeownership is even farther away. ‘There’s a lot of nihilism around long-term goals like home buying.’”
It is unfortunate to hear about this nihilism. It would have been helpful to note that it does not correspond to the data. While homeownership rates have fallen back somewhat in the last few quarters, as a result of the sharp jump in mortgage rates, they are still above the pre-pandemic levels.
This is true across the board, including for young people. The graph below shows the homeownership rate for households under age 35.
Source: Census Bureau, Table 6.
Note that in the most recent quarter, the homeownership rate for households under 35 was 38.3 percent, which is up from 37.6 percent in the fourth quarter of 2019, the last quarter before the pandemic.[1] That was when Donald Trump was still in the White House and the New York Times was not running article after article about how young people could not afford to buy houses.
Let me just repeat this point for the benefit of any elite types that might be reading this. The New York Times has repeatedly run pieces on the impossibility of homeownership for young people during the Biden administration. It did not run pieces on the impossibility of homeownership among young people when the homeownership rate was lower during the Trump administration.
Now, there is clearly an issue at the moment with high mortgage rates, but mortgage rates always fluctuate, and even the article notes that they have already fallen and are likely to fall further in the near future. It would be a bit bizarre for someone to have little hope of owning a home for long into the future based on a short-term rise in mortgage rates that is already being reversed.
If mortgage rates follow the 10-year Treasury bond rate downward, and the extraordinarily large gap between the 30-year mortgage rate and the 10-year Treasury bond rate is reduced, we may be looking at mortgage rates below 6.0 percent before long. That’s still somewhat higher than the pre-pandemic rate, but not high by historic standards.
The piece also talks about the runup in rents. This is undoubtedly a big deal for young people, since they are twice as likely to be renters as the rest of the population. However, it would be worth pointing out that rental inflation has pretty much stopped and rents may actually be falling.
Indexes of apartments that come on the market are now showing that rents have leveled off over the last half year. This slowdown in rental inflation will eventually show up in the government data, however, there is a lag, since the government rental indexes include all rental units, not just the ones that turn over. However, people actively looking for an apartment would be benefitting now from the lower inflation, or even falling rents.
It may well be the case that young people see a huge crisis in the housing market, but in that case the story should be how their perceptions are so much at odds with the reality, not an article that wrongly implies the reality is horrible.
[1] The big jump in ownership rates in 2020 was likely an artifact of the shutdown, when response rates to the survey plunged. (Correction: It has been pointed out to me that the 2020 rise was due to young people moving back in with their families during the pandemic. This reduced the number of households, raising the share who were homeowners.)
Read More Leer más Join the discussion Participa en la discusión
There is a clear disconnect between how people rate the economy (the general economy, not their own economic condition – which most say is good) and standard measures of economic performance. This disconnect has led to a “vibes” vs economic reality debate, with one side arguing that negative news coverage and social media have led people to rate the economy poorly, while the other side argues that weak or declining real incomes explain negative attitudes.
Nate Cohn entered the vibes vs real economic conditions controversy with a unique contribution. He said that even though most standard economic measures, like employment, wages, and income suggest that people are doing pretty well, “factors dragging down consumers aren’t neatly captured by the usual economic statistics.”
“…some basic things have become harder. It’s harder to hire. It’s harder to get a loan. It’s more expensive to buy things. At times it was impossible to buy things because of supply chain shortages. It’s harder to buy a home. It’s harder to sell a home. If you wanted to engage in these kinds of economic activities, you should have done them before the fall of 2021.”
Cohn’s comments here are obviously speculative, he presents no data to support these assertions, but it’s worth considering the idea more carefully.
Some things definitely are harder today than in prior years, like buying and selling a home. With mortgage rates peaking at over 8.0 percent (they are now back under 7.0 percent), sales of existing homes fell by close to one-third from the 2021 pace. This is bad news, but still, the people who are actively looking to buy or sell a home in a given year (around 6 million, typically) are a relatively small share of the population.
Also, if we are looking at the negative story of high-interest rates, we should also look at the positive story that 14 million homeowners refinanced a mortgage during the period of low-interest rates from 2020-2022. Those who refinanced without taking out additional cash saved an average of more than $2,600 a year on interest payments. These savings do not show up in our standard data on income or disposable income.
Cohn tells us that it is harder to hire. This is true, but how many of us are looking to hire people? I suppose if we are looking for people to do work around the house, this could be the case. That is “the hard to get good help” theory of economic malaise.
The obvious flip side of it being harder to hire is that it is easier to find work. Ease of finding work is also not picked up in standard economic statistics and, as a practical matter, there are far more people who would be looking to find work than to hire.
We then have the claim that things are more expensive. That is true, but incomes have grown by more, and this is picked up in our economic statistics.
But then we have the claim that it is harder to buy things. There were certainly shortages of many items in 2021 and even into 2022, making it harder to buy many items. But by 2023, most of these shortages have disappeared. If this were a major factor in people’s economic discontent, we should have seen consumer sentiment improving over the course of the year, instead of deteriorating.
There also is another side to this issue. Online sales have exploded since the pandemic. Online sales accounted for 12.6 percent of retail sales in 2019. They now account for 16.7 percent of retail sales, an increase of more than a third. And this only counts the sales by online distributors, it does not include the growth of Internet sales for brick-and-mortar retailers or the explosion in food delivery from restaurants.
There are other important ways in which life has gotten easier that don’t show up in our standard economic data. Perhaps the top item in this category is the increase in the number of people able to work from home. According to the Bureau of Labor Statistics, 38 million people worked from home on average day last year. That’s an increase of more than 11 million from before the pandemic.
For these people, life is presumably considerably easier. In addition to the time saved on commuting, they are likely saving thousands of dollars a year on transportation and other costs associated with going to work at an office or other workplace.
In the same vein, telemedicine has become far more widely used. According to the Department of Health and Human Services, 22 percent of the population used telemedicine for a consultation with a healthcare professional in a typical four-week period. Since most people do not see a healthcare professional in any given four-week period, this implies a very large share of medical consultations are now done remotely.
This is a huge savings on time spent traveling to and from hospitals or other medical facilities. The benefits from being able to have a remote consultation are likely to be especially important to people in poor health, who disproportionately are the individuals seeking medical care.
In short, contrary to Nate Cohn’s assessment, there are many clearly identifiable ways in which life has gotten easier that are not picked up in economic statistics. To be fair, he was clearly just speculating in throwing out his life-getting-harder hypothesis, but it does not look like it holds up well under closer scrutiny.
Read More Leer más Join the discussion Participa en la discusión
Government-granted patent monopolies have become pretty much sacred in the United States. In fact, when high drug prices become a political issue, most discussion, including from progressives, turns reality on its head. The standard story is that the market creates high drug prices, the issue is whether the government should intervene through some type of negotiation or price control to bring prices down.
Government-granted Patent Monopolies Are the Cause of High-Priced Drugs
In fact, in almost all cases, drugs are cheap to manufacture and distribute. The reason that drugs can be expensive is that the government grants patent monopolies that prevent companies from entering the market.[1] When a single company has a legal monopoly on a drug that is essential to some people’s health or life, they can charge a large amount of money. It is the government-granted monopoly that makes the drug expensive, not the free market.
President Biden proposes to limit the legal monopoly given to at least some drugs, by using the provision of the Bayh-Dole Act that requires inventions that rely on government-funded research be made available at a reasonable price. The Bayh-Dole Act is a measure passed by Congress in 1980 that formalized the process whereby private companies could secure patents on publicly funded research.
It had a huge impact on research generally, but nowhere is its impact clearer than in the case of prescription drugs. From 1960 to 1980, when the bill was passed, spending on prescription drugs was around 0.4 percent of GDP (around $100 billion a year in today’s economy), with no clear upward trend. After the bill was passed spending on prescription drugs began to rise rapidly. It now stands at more than $500 billion, or 2.0 percent of GDP. If we add in non-prescription drugs (the distinction is not necessarily very useful), it comes to $630 billion or 2.3 percent of GDP.
If these drugs were sold in a free market, without patent monopolies or related protections, we would likely be paying less than $100 billion a year. The difference of $530 billion between the patent-protected price and the free market price, comes to more than $4,000 per family.
The issue here is more than just money. People need drugs when they have health problems. This is not a good time to force someone to have to dig up some vast sum of money to pay for a drug to treat cancer or some other serious illness. Even if they are lucky enough to have insurance, no insurer is happy to pay out tens of thousands of dollars for a drug. It is likely to force a patient to jump through all sorts of hoops to get an expensive drug covered. Again, this is not the sort of thing a person with a serious health problem needs.
The high prices are almost entirely a consequence of protection. A recent study found that prices fall by 80-90 percent after a drug has been subjected to a period of generic competition. In the cases of the highest-priced drugs, the drops can be even more dramatic. When the Hepatitis C drug Solvadi was first introduced it sold for $80,000 in the United States for a three-month course of treatment. At the same time, high-quality generic versions were available in India for $900, just over 1.0 percent of the U.S. price.
It would be a struggle for anyone to come with $80,000 to pay for Sovaldi and no insurer is happy to pay that sort of money. The generic price of $900 is a very different story.
The huge gap between the protected price and the free market price also provides an enormous incentive for corruption. Drug companies want to push their drugs as widely as possible, encouraging people to use them even when they may not be the best course of treatment or could even be harmful.
The most dramatic instance of such abuse is the opioid crisis, where Purdue Pharma and other manufacturers paid out billions of dollars in settlements over allegations they deliberately misled physicians and the general public about the addictiveness of the new generation of opioid drugs. The opioid case is extreme in its consequences however, this sort of abuse happens all the time.
Medical journals have to constantly develop new tactics to ensure that the articles they publish are actually written by the people who appear as their authors, and that they have not been paid to put out claims that may not be accurate. In a recent case, intensive lobbying by a drug manufacturer got the FDA to approve an Alzheimer’s drug, Aduhelm, over the objections of its advisory panel. There was little evidence of the drug’s effectiveness and it did have harmful side effects. The drug was slated to sell for $55,000 for a year’s dose.
For these reasons, it is likely that lowering drug prices will actually result in better health outcomes. If there is no one who has a major incentive to mislead the public about the safety and effectiveness of a drug, we are more likely to get accurate information about the usefulness of different drugs for treating various conditions.
Who Pays for Research?
The pharmaceutical industry always screams bloody murder over any measure that will lower drug prices and reduce its profits. They claim that this will be a huge hit to their research spending, and then we won’t get any new drugs.
There will undoubtedly be some negative effects on research spending if profits fall, but the industry hugely overstates the impact. The industry spends roughly $120 billion a year on research and development. This money comes from the gap of more than $500 billion a year between the revenue from selling their drugs and what it costs to manufacture and distribute them.
Over $100 billion of this is profits, but there are many other uses of the money obtained through patent rents. A substantial chunk goes to the pay of CEOs and other top executives. For example, Pfizer’s CEO was paid $33 million last year. He would have been paid considerably less if the company’s drugs were selling at one-fifth of their current price. The bloated pay goes well beyond the CEO, patent rents lead to considerably higher pay for several layers below the top echelon of employees.
In addition, the huge patent rents lead to large payments for marketing drugs. When drugs can be sold at markups of 500 or 1000 percent above their production costs, it makes sense to spend a lot of money trying to promote them widely. For this reason, drug companies spend tens of billions of dollars every year marketing their drugs. This includes not only the ads they run on TV (which had been illegal until a few decades ago) but also money paid to the drug detailers who push the drugs directly to doctors.
Drug companies also pay out vast sums to lawyers, as intellectual property law is one of the most lucrative areas of law. If you’re suing someone over a patent worth billions of dollars, it is a good investment to spend hundreds of millions pushing your case. And, there are the billions of dollars they have to pay out when they lose a case, as was the situation with Purdue Pharma and the other major opioid makers.
All of these payments can be reduced, rather than cutting research spending, when the pharmaceutical industry’s profits dip as a result of lower prices. There is also another area where savings can be found rather than reducing important research into new drugs.
Much of the industry’s spending goes to drugs that largely duplicate existing drugs. The logic is that if one company is earning large patent rents on a particular drug, say the weight loss drug Wegovy, it makes sense from the standpoint of maximizing profit to try to produce a competitor that can share in these rents.
This is actually desirable in a world where drugs are selling at patent-protected prices. Having two, three, or four drugs that are largely similar, all of which have patent protection, will still help to bring prices down. There is also likely to be some health benefit, since patients react differently to the same drug, so having the option to take a different drug will be valuable to some patients. However, as a general rule, research dollars would likely be better spent trying to develop drugs for conditions where no effective treatment currently exists rather than trying to duplicate the function of existing drugs in order to get a share of patent rents.
In 2021, the most recent year for which the data are available, the FDA rated more than 56 percent of its drug reviews as “standard,” meaning that the drugs did not represent a qualitative breakthrough over existing drugs already on the market. It would not in general be a major loss to public health if the research spending on these duplicative drugs was reduced as a result of lower drug prices and profit margins.
Government Spending on Research
But even if the reduction in industry profits will only be reflected in a limited way in reduced research spending, there is no doubt that the companies will be spending somewhat less on money on developing new drugs. This doesn’t have to mean a reduction in total spending on research.
The federal government already spends well over $50 billion a year on biomedical research, primarily through the National Institutes of Health, but also through BARDA, the CDC and a number of other government agencies. This money primarily goes to more basic research, but many drugs have been developed on public money and often tested as well. The most famous recent example was the Moderna COVID vaccine, where Operation Warp Speed paid for both the development and the clinical trials needed for the vaccine’s approval, but there have been many others.
Public funding can serve as a substitute for industry funding. Recent research indicates that increased NIH funding can be a very effective substitute for industry funding. In fact, it suggests that dollar for dollar, NIH funding may be far more effective, with a 10 percent increase in funding (roughly $5 billion a year at present) leading to a 4.5 percent increase in the number of drugs developed. This result, taken crudely, implies that for $110 billion in additional spending, we could fully replace the spending done by the industry, with no loss in the number of new drugs developed.
Of course, the world is far more complicated than this sort of simple multiplication would imply, but most of the complications likely mean the cost of replacing industry research would likely be lower rather than higher. To start with, if we were financing research with the goal of advancing health rather than seeking patent rents, we would likely see much less money wasted in duplicative research.
Again, not all of this money is wasted. It is very often helpful to have a second or third drug to treat a condition, since people react differently to drugs and some drugs interact badly with other drugs a patient may be taking. But the search for patent rents is likely to misdirect much research spending compared to a scenario where the focus is public health.
A second reason we may get more health benefits per buck with direct publicly supported research is that there may be many instances where non-patentable items offer the greatest health benefit. For example, there is some research indicating that vitamin deficiencies may be an important factor in many conditions. Drug companies have little incentive to research this possibility since they can’t get a patent on vitamins that have been known for many decades.
The same applies to older off-patent drugs. If there is some evidence Aspirin can provide important benefits in treating a condition, Pfizer or Merck is not going to spend large sums exploring that possibility. If it turns out to be true, they will not be able to recoup their research expenses selling a drug that has long been available as a cheap generic.
But the most important reason that publicly funded research might be more effective on a per-dollar basis is that we can make openness a condition of getting funding. This means that rather than having an incentive to squirrel away findings, in order to avoid allowing a competitor to get an advantage, we can require that the results of publicly funded research be posted on the Internet as soon as practical.
This means that all researchers can benefit from quickly learning of new breakthroughs as well as being warned off dead ends. This openness requirement would also largely eliminate the risk of drug companies misrepresenting research findings to push their drugs as widely as possible.
Not only would we be removing the incentive by taking away the patent monopoly, we would also be removing the opportunity, since the community of researchers would all have access to the same research. We can’t eliminate all mistakes – some mistakes are inevitable – but we can prevent the sort of deliberate misrepresentation of evidence that had such terrible consequences in the opioid crisis and in many other situations.
Patent Monopolies and Inequality
It is common for people in policy circles to assert that the enormous increase in inequality over the last half century was primarily the result of technology. The story is that technology has developed in a way that has benefited people with more education and disadvantaged those with limited education. This is not true.
It is more than a bit absurd to claim that patent monopolies and related protections are necessary for the development of new drugs or to achieve progress in other areas, and then claim that inequality is the result of technology. Our rules on patents and other forms of intellectual property are policy matters, they are not determined by technology.
This point matters hugely in discussions of inequality, since it is policy that determines who benefits from technology and how much. We saw this clearly in the case of Moderna and its development of a COVID vaccine. The contract it signed with the government both paid for the development of the vaccine and then allowed Moderna to keep control of the vaccine.
As a result of this contract, Moderna is selling its boosters for well over $100 a shot, even though it would likely only cost it around $5 a shot to produce and distribute the vaccine. The Moderna contract allowed the company to generate at least five billionaires by the summer of 2022.
The Moderna contract is an extreme case, but it does provide a clear example. How we structure laws around patent monopolies and other protections determines the winners from technology.
It is obviously convenient for the gainers from this upward redistribution to pretend that it was just a natural outcome from technology, but it is not true. If we write the rules differently, we can have much less inequality.
Where Do the Administration’s Bayh-Dole Measures Get Us?
I have long argued for looking to displace the system of patent-supported research for prescription drugs with one of direct public funding. My preferred route is a system of long-term prime contracts, loosely modeled on the sort of prime contracts that the Defense Department awards for military research, where companies would engage in a process of competitive bidding for research in specific areas, such as cancer or heart disease. (I outline this in Chapter 5 of Rigged [it’s free].)
The Biden administration’s proposal is not my proposal for radically overhauling the system of financing the development of prescription drugs. It does, however, raise the issue of how much we will allow pharmaceutical companies to benefit from the patent monopolies we grant them at the expense of the general public.
It allows the government to take advantage of the provision in the Bayh-Dole Act requiring that innovations based on government-funded research be available to the public at a reasonable price. This is a big step forward, since it means that we will not hand drug companies a monopoly on life-saving drugs and then let them charge patients (or insurers or the government) whatever price they feel like. This can save the public and the government billions of dollars each year.
While this measure is important in establishing that patent monopolies are not absolute, it is limited in that it only applies to a limited set of drugs, only those where government-funded research played a direct role in its development. That may seem fair in some ways, but drug companies often don’t acknowledge that they relied on government research in developing a product.
If a drug company relied on another company’s research in developing a drug, it can count on a patent infringement suit, but the government is generally not aggressive in forcing companies to list government patents that played a role in developing a product. The executive order also does not give clear guidance on what constitutes reasonable pricing. It could, for example, have specified that a reasonable price is some average of prices charged in other wealthy countries, like Germany and Canada, but it backed away from this step.[2]
There are of course other modest steps that the Biden administration could take to lower drug prices, some of which it already has. For one, it capped the out-of-pocket payments for insulin, although this has the government picking up the tab, so that is not a measure that costs the pharmaceutical industry money. It is also moving to negotiate the prices that Medicare pays for a number of important drugs, this will save the program and beneficiaries billions of dollars in coming years.
But there are also limited steps that it could take that would push the agenda further. Drs. Peter Hotez and Maria Elena Bottazzi and their team at Texas Children’s Hospital developed an effective open-source COVID vaccine. This vaccine, Corbevax has already been used by over 100 million people in India, Indonesia, and elsewhere.
If this vaccine was approved by the FDA, it would mean that people would have a cheap alternative (likely less than $5 a shot) to the vaccines now on the market, which are selling for over $100 a shot. If the vaccine were available here, it would also mean that people have an alternative to the mRNA vaccines produced by Moderna and Pfizer. While there is little basis for the fears of mRNA technology, if these fears prevent people from getting a vaccine that could protect them from COVID, we should be allowing them an alternative.
Getting a cheap vaccine developed outside the patent system would also provide proof of concept. No one cares that I or others claim that we can produce drugs or vaccines without relying on patent monopolies, they need to see proof in the form of facts on the ground that we can have effective products that don’t depend on these monopolies. Corbevax can be an important fact on the ground. (Many people may not be aware of the enormous savings with this vaccine, since in most cases, the government or private insurers will pick up the cost of COVID boosters.)
A Very Important Step
It is always possible to complain that a particular measure does not go as far as it should, but it is very rare that major change is brought about by a single bill or executive order from a president. The question is whether the measure is a step forward and if it opens the door for future progress.
By this standard, the answer is certainly yes. We can think of this executive order as being comparable to the Inflation Reduction Act (IRA). The provisions of the IRA are nowhere near large enough to address the problem of global warming, but they are a huge foot in the door. In the same way, President Biden’s actions on Bayh-Dole are an important step in reining in drug prices and creating a path for further actions in the future.
[1] There are other forms of exclusivity that can be as important as patent monopolies in blocking competition, most notably “data exclusivity.” This means that when a drug company produces data showing a particular drug is safe and effective, another company cannot rely on this data to establish that its own drug is also safe and effective, even if it can be shown to be chemically the same or similar in the case of biological drugs.
[2] This write-up from Knowledge Economy International provides useful background on some of the issues raised by the Biden Administration’s executive order.
Read More Leer más Join the discussion Participa en la discusión
New York Times columnist Steve Rattner told readers that people think the economy is terrible and then gave some not very plausible reasons why. As Rattner explains:
“As I’ve engaged with my many interlocutors, I’ve concluded that voters have valid reasons for their negativity. In my view, blame two culprits: one immediate and impacting everybody, and another that particularly affects young people and is coming into view like a giant iceberg. Both sit atop the leaderboard of reasons for the sour national mood.”
Okay, first on Rattner’s list, people care about inflation, not jobs.
“To them, higher prices just means less spending power. A recent Blueprint/YouGov poll on the economy found that just 7 percent of respondents were principally concerned about the availability of jobs, while 64 percent were most worried about prices.
“The problem for President Biden is that by a margin of 43 percent to 23 percent, voters believe that he is more focused on jobs.”
Let’s apply a little common sense here. Let’s imagine that people care about both prices and jobs. Right now, because of Biden administration policies, unemployment is very low, so people have jobs. That means they probably are not worried about jobs.
It’s sort of like if you had a patient with a heart problem and a bad knee. After the doctor prescribes a medication that addresses the heart problem, it’s likely that they will be primarily worried about their bad knee. That doesn’t mean they didn’t care about their heart problem, it just means that for the time being, their heart problem is under control.
We also get the refrain that people expect prices to come down. We keep hearing that line in the media. Suppose some number of people expect pigs to fly.
Would we see the line repeated endlessly that people expect pigs to fly? My guess is that we would see some number of pieces ridiculing the fact that some people are expecting the impossible. Then the media would stop reporting it, rather than what we see now where the media continually repeats the idea that people expect prices to go down.
For what is worth, virtually no one expected prices to go back down in the 1980s after the 1970s inflation. And, a point that Rattner neglects to mention, wages have been outpacing prices, so people’s purchasing power has been increasing. That was not true in the 1980s when the media were celebrating the “Reagan boom.”
Then we get to the long-term story.
“The longer-term issue that bubbles up from polls and other data is deep pessimism about the future. Uncharacteristically, a stunning majority of Americans now believe that the next generation is likely to have a lower standard of living.
“A Wall Street Journal-NORC poll from March found that just 21 percent of respondents felt confident that life for their children’s generation will be better, matching the record low since this question was first asked.”
Actually, pessimism about the future is not uncharacteristic. A poll taken in March of 1998, when the economy was in the middle of a five year long boom, found that the number of people who thought that life would be better in the next century was tied with the number of people who thought it would be worse, at 36 percent each.
Rattner’s next step in making his case is that more young people are living at home.
“Consider one marker of generational progress: moving out. Nearly half of all Americans aged 18-29 live at home with their parents, the highest share since the Great Depression.”
Rattner is playing more than a bit fast and loose here. The share of young people living at home was rising through most of the last decade. It jumped during the pandemic, and has been trailing downward in the last year.
He also tells us that high house prices and high interest rates make it difficult for young people to buy homes. That’s true, but until interest rates jumped last year, the number of young people owning homes was increasing and it’s still above pre-pandemic levels. Perhaps Rattner thinks high rates will persist indefinitely, but he is very much in the minority on that point.
Then we get to the big kicker:
“Even more fundamentally, voters — admittedly, not economists — may deserve credit for at least subconsciously comprehending two immense longer-term challenges: lagging productivity and a huge and fast-rising national debt.”
It’s a bit hard to believe that anyone who has followed the economy for the last five decades would cite slow productivity growth as a reason for the current pessimism about the economy. We’ve had slow productivity growth for most of the last half century, why is it just now bothering young people?
The other irony of this comment is that we just got a report showing that productivity grew at an incredibly fast 5.2 percent annual rate in the third quarter. No one expects this pace to continue, and the productivity data are highly erratic, but it is a bit bizarre right now to be claiming that slow productivity growth is the reason for people’s discontent.
Then we get the national debt. The fact is, no one has any clue what the size of the national debt is. If it were half its current size it would still sound like a huge number to people. It’s pretty hard to believe that many people have looked carefully and thought about the consequences of the national debt, although hearing politicians and pundits whine about the debt may have scared them.
If they did want to worry about something that would cost them real money, they might worry about the trillions of dollars they will pay out in future years to drug companies, medical equipment suppliers, and other companies that have government-granted patent and copyright monopolies. But, the recipients of these rents are probably Steven Rattner’s friends, and they don’t allow for such things to be talked about in the New York Times anyhow.
Ironically, Rattner doesn’t mention global warming. The damage that we are doing to the planet gives young people very serious grounds to be worried about the future. But I suppose preventing environmental destruction doesn’t matter to Rattner.
Anyhow, it is possible to make a case in the NYT that things are really bad right now and people should be worried about the economy. It may not be a very solid case, but who cares?
Read More Leer más Join the discussion Participa en la discusión
The NYT had an interesting column today on the growing problem of drug shortages by Emily Tucker. The piece made several important points, but one of them could use a bit more attention.
Tucker notes that a resilient supply chain is not necessarily a domestic supply chain. This is exactly right, but the point deserves far more emphasis than it is given in this piece.
At the height of the pandemic there were shortages of a wide range of items, as demand increased and production was often curtailed due to pandemic conditions. This led to a call for increased domestic sourcing.
Some of this effort was badly misplaced, as stockpiling failings were often treated as supply chain issues. The lack of availability of masks and other protective gear was a stockpile problem, not a supply chain problem.
Even if all our masks were produced in Ohio, we could not get the hundreds of millions of masks needed at the start of the pandemic. It takes time to produce a huge number of masks and large volumes of protective gear more generally. These should have been stockpiled.
The fact that the country did not have a substantial stockpile at the start of the pandemic was a major failing of the Trump administration. This made it harder to curtail the spread of the disease and needlessly exposed many healthcare workers at a time when there were no vaccines or effective treatments.
Part of the problem with drugs in short supply is that many have limited markets. If a drug is designed to treat a relatively rare disease, there will not be an incentive for a company to have large amounts of backup capacity, or to spend a lot of money ensuring the quality of its manufacturing process, once it is available as a low-priced generic.
However, if the drug is being produced for a worldwide market, and not just the U.S. market, it is more likely that there will be several manufacturers producing any given drug. In that scenario, there will be a higher probability that one company’s output can be replaced by competitors, if it is forced to temporarily stop operating due to mechanical problems or quality control issues.
For this reason, it is important that we look to make the market as large as possible. This means removing barriers, other than necessary quality controls, to imports and encouraging other countries to do the same. In this story, a resilient supply chain is an international supply chain that encompasses as large a share of the world as possible. Restricting ourselves to domestic producers is the wrong way to go.
Read More Leer más Join the discussion Participa en la discusión
The reported saving rate has fallen sharply from its pandemic peaks, causing many commentators to speculate that people are running out of savings. At first glance, that is what the data show, with the saving rate for the most recent quarter coming in at 4.0 percent. That is up somewhat from the 3.3 percent rate of 2022, but down sharply from the double-digit rates of 2021, and well below the 7.0 percent plus rate we saw just before the pandemic. But there are some complicating factors that could change the picture.
National Income Versus Gross Domestic Product: The Mystery of the Statistical Discrepancy
In principle, we can measure gross domestic product on either the income side, adding up wages, rents, profits, and other forms of income or measure it on the output side, summing consumption, investment, government spending and net exports. We should get the same number either way, every dollar we spend buying things is income for someone.
As a practical matter, they never come out to be exactly the same, which is not surprising in a $27 trillion economy. The gap between the two is the statistical discrepancy. It usually is less than 1.0 percent of GDP in absolute value (it is positive if output exceeds income, negative when income is higher), but it can be larger, especially before the data are subject to comprehensive revisions over two or three years.
In recent quarters it has grown to be a large positive number, with measured output exceeding income by 2.5 percent of GDP ($688 billion). Most likely neither the income measure or output measure is exactly right, with the true number being somewhere in the middle. It is common to simply take the average of the two, with the idea that this is likely to be closer to the mark.
If we do this, we get that personal income is higher than the figure used to calculate the saving rate in the third quarter. (Saving is calculated as personal income, minus taxes and consumption.) I calculated an adjusted measure for personal income that assumes that the actual level of national income is equal to reported national income, plus half of the statistical discrepancy. (I adjusted for the small difference between personal income and national income by multiplying by the reported ratio for the two [NIPA Table 1.7.5, Line 25 divided by Line 16].)
I then calculated an adjusted saving rate, using this measure of adjusted personal income, instead of the reported measure of personal income. This came to 5.7 percent in the most recent quarter, as opposed to the 4.0 percent shown in the published data. This is shown in the figure below.
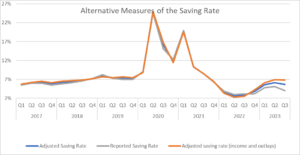
Source: Bureau of Economic Analysis and Author’s Calculations, see text.
However, if we think that the true measure of GDP lies halfway between the output side measure and the income side measure, then we should also adjust the output side of the calculation. This means that consumption will be somewhat lower than is reported. This will further increase the saving rate as shown in the adjusted saving rate line with both income and outlays adjusted.[1]
With this adjustment, the drop in the saving rate is largely eliminated. The saving rate in the third quarter, with both income and consumption adjusted, is 6.8 percent, higher than the averages for both 2017 and 2018. This implies that the widely touted drop in the saving rate in 2023 might just be a problem with measurement.
Taxes and Savings
There is one other point worth making about the saving rate. Savings are measured as income minus taxes. Taxes jumped in 2022. This was not because of an increase in the tax rate, it was due to the fact that people were paying capital gains taxes on stocks that they sold. Since capital gains do not count as income, selling stock at a profit and paying taxes on the gains, means households have lower disposable income.
This means, for example, if a household paid $2,000 in taxes on $10,000 in gains, its disposable income would be $2,000 lower in the year it sold the stock than in the prior year, even if its other income was exactly the same.
We can adjust for the impact of tax payments by simply taking savings (adjusted savings here), plus taxes, as a share of adjusted personal income. This is shown in the figure below.
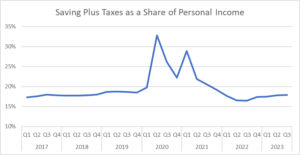
Source: Bureau of Economic Analysis and Author’s Calculations, see text.
As can be seen, there is a modest dip in this measure in the second half of 2022, but the most recent figure of 17.9 percent is above the 2017 and 2018 averages. By this measure also, it seems that the drop in the saving rate is just the result of measurement error.
[1] I multiplied reported outlays by 1 minus half the size of the statistical discrepancy (Table 2.1, Line 28 *(1-0.5*(Table 1.7.5 (Line 15/Line1).
The reported saving rate has fallen sharply from its pandemic peaks, causing many commentators to speculate that people are running out of savings. At first glance, that is what the data show, with the saving rate for the most recent quarter coming in at 4.0 percent. That is up somewhat from the 3.3 percent rate of 2022, but down sharply from the double-digit rates of 2021, and well below the 7.0 percent plus rate we saw just before the pandemic. But there are some complicating factors that could change the picture.
National Income Versus Gross Domestic Product: The Mystery of the Statistical Discrepancy
In principle, we can measure gross domestic product on either the income side, adding up wages, rents, profits, and other forms of income or measure it on the output side, summing consumption, investment, government spending and net exports. We should get the same number either way, every dollar we spend buying things is income for someone.
As a practical matter, they never come out to be exactly the same, which is not surprising in a $27 trillion economy. The gap between the two is the statistical discrepancy. It usually is less than 1.0 percent of GDP in absolute value (it is positive if output exceeds income, negative when income is higher), but it can be larger, especially before the data are subject to comprehensive revisions over two or three years.
In recent quarters it has grown to be a large positive number, with measured output exceeding income by 2.5 percent of GDP ($688 billion). Most likely neither the income measure or output measure is exactly right, with the true number being somewhere in the middle. It is common to simply take the average of the two, with the idea that this is likely to be closer to the mark.
If we do this, we get that personal income is higher than the figure used to calculate the saving rate in the third quarter. (Saving is calculated as personal income, minus taxes and consumption.) I calculated an adjusted measure for personal income that assumes that the actual level of national income is equal to reported national income, plus half of the statistical discrepancy. (I adjusted for the small difference between personal income and national income by multiplying by the reported ratio for the two [NIPA Table 1.7.5, Line 25 divided by Line 16].)
I then calculated an adjusted saving rate, using this measure of adjusted personal income, instead of the reported measure of personal income. This came to 5.7 percent in the most recent quarter, as opposed to the 4.0 percent shown in the published data. This is shown in the figure below.
Source: Bureau of Economic Analysis and Author’s Calculations, see text.
However, if we think that the true measure of GDP lies halfway between the output side measure and the income side measure, then we should also adjust the output side of the calculation. This means that consumption will be somewhat lower than is reported. This will further increase the saving rate as shown in the adjusted saving rate line with both income and outlays adjusted.[1]
With this adjustment, the drop in the saving rate is largely eliminated. The saving rate in the third quarter, with both income and consumption adjusted, is 6.8 percent, higher than the averages for both 2017 and 2018. This implies that the widely touted drop in the saving rate in 2023 might just be a problem with measurement.
Taxes and Savings
There is one other point worth making about the saving rate. Savings are measured as income minus taxes. Taxes jumped in 2022. This was not because of an increase in the tax rate, it was due to the fact that people were paying capital gains taxes on stocks that they sold. Since capital gains do not count as income, selling stock at a profit and paying taxes on the gains, means households have lower disposable income.
This means, for example, if a household paid $2,000 in taxes on $10,000 in gains, its disposable income would be $2,000 lower in the year it sold the stock than in the prior year, even if its other income was exactly the same.
We can adjust for the impact of tax payments by simply taking savings (adjusted savings here), plus taxes, as a share of adjusted personal income. This is shown in the figure below.
Source: Bureau of Economic Analysis and Author’s Calculations, see text.
As can be seen, there is a modest dip in this measure in the second half of 2022, but the most recent figure of 17.9 percent is above the 2017 and 2018 averages. By this measure also, it seems that the drop in the saving rate is just the result of measurement error.
[1] I multiplied reported outlays by 1 minus half the size of the statistical discrepancy (Table 2.1, Line 28 *(1-0.5*(Table 1.7.5 (Line 15/Line1).
Read More Leer más Join the discussion Participa en la discusión
The Washington Post ran a lengthy article about how Ava DuVernay is having her latest film financed by the Ford Foundation, as well as foundations supported by Melinda French Gates and Lauren Jobs. The piece describes the film, and notes how this can be a new model for financing artistic films that for-profit studios may not support:
“It’s a patronage model reminiscent of the charity bestowed on art museums or opera companies — high-cultural institutions that couldn’t survive without deep-pocketed benefactors.”
However, an important fact that did not get mentioned in the Post’s piece is that the charitable contributions made by the rich people who finance these foundations involve a large taxpayer subsidy.
While the size of the charitable contribution tax deduction has varied, depending on the tax rates at the time on incomes and estates, it has been roughly 40 percent. This means that taxpayers are picking up the tab for 40 cents of every dollar that these rich people choose to contribute to support Ms. DuVernay’s film. (To be clear, this is not at all a criticism of her new film. She is an accomplished filmmaker, and from the write-up in the article, it sounds like a very worthwhile project.)
The fact that the “patronage model” involves a large element of taxpayer subsidy seems an important point that might have been worth noting. While many of us may think it is a good idea for the government to support creative work and creative workers, we might not think that it’s best that the rich be the ones who decide which work deserves the taxpayers’ support.
A Democratic Alternative to the “Patronage” Model
Under the current system, the rich get the vast majority of the benefits from the charitable contribution tax deduction. This is both because they are taxed at a higher rate, so that $1 off of their taxable income saves them more money than $1 off the taxable income of a moderate or middle-income person, and also because the rich are far more likely to itemize their tax deductions.
Only 11.4 percent of taxpayers itemize their deductions, most of whom are at the top end of the income distribution. The overwhelming majority of taxpayers use the standard deduction. For them, the charitable contribution tax deduction is of no value whatsoever.
However, we could redesign this structure to make the benefits more evenly spread by changing the tax deduction to a credit. And, if we think it is important for the government to subsidize creative work, we could designate that this credit be used to support creative work.
The way this could work is that we would give every adult a credit of some size (say $100 to $200), which would be used to support the creative worker or organization that supports creative work, of their choosing. If we assume that every adult in the country could use their credit, this comes to between $25 billion and $50 billion a year, which would be a good chunk of change to support creative work.[1]
To be eligible to receive money through this system, a person or organization would register with the I.R.S., or a new agency, indicating what creative work they did. This registration would be similar to what non-profits do now to get tax-exempt status from the I.R.S.
They must say what they do that qualifies them for tax-exempt status; are they a church, a charity that provides food to the poor, or a think tank? The I.R.S. doesn’t make an effort to determine whether they are a good church, charity, or think tank, they just determine whether they do what they claim and if that would qualify them for tax-exempt status.
The same would be the case for individuals or organizations that register to be eligible for the creative work tax credit. They would indicate they are a writer, a movie producer, a singer, etc. Alternatively, an organization could register saying that they support blues musicians, mystery writers, or historical movies.
A condition of getting the money could be that the recipients are not eligible for copyright protection for a substantial period of time, say three to five years. The logic here is that the government gives people one subsidy for their work, not two. Copyright monopolies are one mechanism the government uses to support creative work. There is no reason that it should give people who benefit from this mechanism an additional subsidy in the form of money from a tax credit.
There is also the issue that the point of the credit is to support creative work for people to enjoy. If the work produced with the credit is paywalled and comes with a high price tag, not many people will see it. By contrast, if any work supported through this system is freely available over the web, it should attract the widest possible audience.
This copyright provision also has the benefit that it is largely self-enforcing. If someone who was getting money through the system tries to get a copyright during the period in which they are ineligible for copyright protection, their copyright is simply unenforceable. If a false copyright claimant attempts to bring a suit for copyright violation against someone, the person simply points out that the claimant was in the tax credit system and therefore their copyright is not valid.
The system for taxpayers using the credit would be similar to what is now in place for the charitable deduction. They could just indicate on their tax return that they had paid a certain amount to a qualified person or organization, with the understanding that they could be later asked for evidence that they had made this contribution.
Also, since the plan would be that everyone would have access to the credit, even if they did not pay income taxes, the system could be designed so that the government makes this payment directly on the taxpayer’s behalf. This would mean that they could fill out a form indicating which creative workers or organizations they wanted to support, and the government would make the payment.[2]
There obviously are many details that would need to be worked out in designing this sort of system, and there will undoubtedly be problems, but that is true with any system, including the current charitable contribution deduction. We could design the system to prevent obvious scams, for example, requiring that people get at least $3,000 in credit money, in order to be able to collect anything through the system, would prevent any sort of simple trading of credits. The key point is that we could design a government-funded system for supporting creative work that does not rely on the whims of the rich, as is now the case.
Journalism, a Special Case
The collapse of newspapers over the last quarter century, and especially local newspapers, has created interest in devising a system whereby the government supports this vital service. There have been various routes proposed, but there are efforts in at least two cities, Washington and Seattle, that have proposed this sort of individual credit or voucher system.
If one of these cities can get a news voucher system up and running, it would both do much to revitalize journalism in their community, and also provide a model for a more democratic system of taxpayer funding for creative work. The fact is, we do not need rich people to decide which creative work the government should support.
We should have a broader discussion on how taxpayer funding for the arts should be used. That would require some clearer thinking on this topic than what we see in public discussions today. It might also require some new ideas. We know the old saying that intellectuals have a hard time dealing with new ideas, but we need to have the discussion anyhow.
[1] I outline this sort of system in my book Rigged (it’s free).
[2] This route of direct payments might be preferable in a start-up phase where participation could be low. Suppose the credit was set at $100 a person, with the idea that if 250 million people took advantage of the credit, $25 billion would be paid out to creative workers. If the payments were made through a centralized system, and just a small number – say 25 million people – opted to use the credit, then the value of the credit could just be increased by a factor of ten. This would mean that each person who used their credit would effectively be contributing $1,000 to the creative workers/organizations of their choice.
The fact that the credits were initially far more valuable than originally intended should provide people with a strong incentive to participate in future years. In any case, this system would ensure that a substantial pot of money was available to support creative work.
Read More Leer más Join the discussion Participa en la discusión


