• COVID-19CoronavirusHealthcarePost-COVIDUnited StatesEE. UU.

Read More Leer más Join the discussion Participa en la discusión
• Consumer Price IndexEconomic Crisis and RecoveryCrisis económica y recuperaciónEconomic GrowthEl DesarolloUnited StatesEE. UU.

Read More Leer más Join the discussion Participa en la discusión
• Economic GrowthEl DesarolloJobsTrabajosUnited StatesEE. UU.WagesWorkersSector del trabajo

Read More Leer más Join the discussion Participa en la discusión
That’s what the Census Bureau data for the first quarter of 2023 showed, in a report completely ignored by the media. While NPR was telling us that the homeownership rate reported in the 2020 Census hit its lowest level in half a century (this was the top of the hour news summary, no link), the data the Census Bureau puts out quarterly tell the opposite story.
Homeownership rates have been rising throughout the pandemic and the recovery, hitting levels not seen since the collapse of the housing bubble. The homeownership rate for households with less than the median income hit 53.4 percent in the first quarter of 2023. That’s up from 51.4 percent in the fourth quarter of 2019, and the highest at any point since 1994 when the series begins. For some reason, it doesn’t seem the media think a record high homeownership rate for moderate-income people is newsworthy.
There is a comparable story for homeownership rates for Black people, which rose to 45.8 percent in the first quarter, compared to 44.0 percent before the pandemic. For Hispanics, the homeownership rate in the first quarter stood at 49.7 percent, up from 48.1 percent in the fourth quarter of 2019. The homeownership rate for people under age 35 was 39.3 percent in the first quarter, a 1.7 percentage point increase from 37.6 percent pre-pandemic rate.
The quarterly data are erratic, and this picture could change with high current mortgage rates, which could go higher with more rate hikes from the Fed. But the point here is that there is a really good story on homeownership that the media is not only ignoring it, but telling people the opposite. I would be tempted to say “FAKE NEWS!,” but I can’t afford the royalty payments to Donald Trump.
Read More Leer más Join the discussion Participa en la discusión
When I saw that two of the country’s most prominent economists wrote a book on “our 1000-year struggle over technology and prosperity,” I expected a lot. I was disappointed. To be clear, there is much here to like and I’m sure that most readers will get much from it, as I did. But, the book fails to follow through adequately on the key point in its analysis, which is that the gains from technology are a matter of struggle, not an outcome given by the technology itself.
I’ll start with the positives. The book gives a cursory, but useful, account of the major developments in technology going back more than a thousand years. Some of their discussion deals with the origins of agriculture, an innovation that goes back many thousands of years. However, most of the book does describe events in the promised thousand-year horizon.
It points out that there were important technological innovations in the Middle Ages, which did allow for very modest gains in productivity and living standards across much of Europe until the 13th or 14th century. At that point, the rate of increase accelerated, although it was still much slower than in later centuries.
One of the points it makes, which was underappreciated (at least by me), was the extent to which the gains in this period were siphoned off by the church. The huge cathedrals and monasteries constructed in this period absorbed a huge chunk of the surplus produced in agriculture. This both depressed living standards and prevented resources from going to investments that would increase productivity.
As technology continued to advance in the subsequent centuries, there were modest gains in living standards for large sections of the population as the demands of the church were reined in. However, the book makes clear that there was no automatic transmission from improvements in technology to gains in living standards for the bulk of the population.
In particular, the book points out that the early years of the industrial revolution in 19th century England were associated with a deterioration in living standards for large segments of the working class. Factory workers, and especially children, were forced to work longer hours under worse conditions than ever would have been the case in agriculture. In addition, the living conditions in cities were far more unhealthy than what they faced in the countryside.
When conditions for the English working class did subsequently improve in the second half of the 19th century, it was due to the growing political power of the working class, as well as the growing importance of labor unions.
They also point out that the direction of technology itself is very much determined by power relations. In particular, they note that the enclosure movement in England was not, in fact, about allowing for the transition to more modern crop rotations. There were many places where improved crop rotation systems were adopted in open fields. Rather, enclosure was about giving landlords more control over land and displacing the peasantry.
None of this would be new to people familiar with the history of this period, but it is still refreshing to see prominent economists make these points. The distribution of the benefits of technology is far from being determined by strictly economic factors. It depends very much on the institutional structure and power relations in society.
It is Not Just the Masses Who Rely on Political Power to Secure the Gains from Technology
However, having said this, my major criticism of Acemoglu and Johnson is that they fail to carry this critique far enough. While they discuss extensively the factors that have allowed for gains in the past for ordinary workers, and which could go further in the future, they don’t consider the ways in which the winners have structured the economy to ensure that they get the bulk of the benefits of growth. In effect, the book treats the upward redistribution as a natural outcome of the development of the market and technology, whereas it requires interventions to ensure that gains are widely shared.
Just to take the most obvious case (and my favorite target), the money that goes to the top end of the income distribution due to patent and copyright monopolies is entirely due to the winners’ ability to write the laws on intellectual products in ways that benefit them. If the government didn’t threaten to imprison people who copied Microsoft software without his permission, Bill Gates would still be working for a living. It wasn’t technology that created five Moderna billionaires, it was the fact that the government paid the company to develop a Covid vaccine, and then allowed Moderna to have monopoly control over its distribution.
If it is difficult to understand the idea that government policy on technology, rather than the technology itself, created a huge amount on inequality, imagine a world where we had no patent and copyright monopolies and non-disclosure agreements were unenforceable. Arguably, we would have seen less technological progress, depending on what, if any, alternative incentive mechanism we used; but surely we would see nothing like the inequality that has resulted from preserving and expanding these monopolies over the last four decades.
Similarly, it was not just technology that allowed us to subject manufacturing workers to competition from their much lower paid counterparts, but protected highly paid professionals. There is no technical reason that we can’t all have Zoom consultations with doctors in India who get paid one-tenth as much as doctors in the United States. Globalization has not had as much impact on the pay of highly paid professions because of their power, not because of technology.
And of course, the big bucks made by the top people in finance is not due to the wonders of technology, but the fact that a politically powerful industry was able to rig the rules. The too-big-to-fail insurance on vivid display in the Great Financial Crisis, and again following the collapse of the Silicon Valley Bank, is only part of the story.
We have the technology to make the financial system far more efficient, starting with Federal Reserve banking accounts and running into just about every area of finance, but it doesn’t happen because the big players in the financial industry don’t want to see a hit to their income. No one knows this better than Simon Johnson, who has written extensively on the abuses and corruption in the financial industry, but for some reason this is mentioned only in passing in Power and Progress.[1]
These points are not nit-picking. It is not just the masses who need to change the rules to get their fair share of the gains from productivity growth, it is also the rich who change the rules to their benefit. This point is essential both as a matter of logic and politics.
It is also important to recognize that we improve the living standards of ordinary workers not only by getting them more money, but by giving the rich less. If the rich have less money to buy multiple houses, then housing is cheaper for everyone else. And, if they have fewer personal servants fulfilling their whims, there are more workers available to meet the needs of the rest of the population.
There are no preset given rules of a market economy. We make them up as we go along. If we want to see more equality and a system where the vast majority, and not just a lucky few, share in the benefits of progress, we can go two routes. One is the route Acemoglu and Johnson advocate throughout the book: strengthen workers’ bargaining power and expand the welfare state. But, we can also work the other side; weaken the institutional structures the rich have been putting in place to make themselves richer. We should, of course, be opportunistic and make advances on both sides wherever we can, but it makes no sense to ignore the other side.
Will AI and Related Technologies Change the World?
I have one other small bone to pick with Acemoglu and Johnson. They look at the developments in AI and are largely dismissive of the idea that it will lead to another productivity boom. As they note, we have been hearing the promises of a computer-driven productivity boom for decades and have yet to see it.
I share their skepticism, having listened to the same promises. However, I will cautiously suggest that this time might be different. According to the analyses of Nick Bloom and his colleagues, between 25-30 percent of work days are now remote. This is up from around 5 percent before the pandemic.
This is a huge change in the lives of tens of millions of people. They are saving hundreds of hours a year in commuting time and thousands of dollars in commuting related expenses. These benefits are not picked up in our productivity or GDP data. Commuting time is not counted as work hours, even though most commuters would probably rather be spending that time at work than commuting.
Also, expenses associated with commuting, like gas, train, and bus fares, as well as dry-cleaning services and the costs of business clothes, are just treated like any other consumption. Most immediately, less spending on these items would actually be treated as a drop in GDP.
While the option to work at home is disproportionately available to more educated workers, it clearly goes beyond a small elite. In this respect, it is worth noting that after the surge in remote work and an unprecedented rate of job switching, a Conference Board survey shows workers report their job satisfaction is the highest in the four decades the survey has been taken.
To my view, we have not yet reaped the full benefits of this revolution in the opportunity to work remotely. The option to do things remotely is likely to be extended in many different directions, most obviously with telemedicine.
Again, many of these benefits will not be picked up in GDP and productivity data, but they will make a real difference in people’s lives. The fact that a person in bad health doesn’t have to travel across town or across country to consult with a medical professional makes a huge difference to that person and their family, but does not show up anywhere in the GDP accounts. So, while I respect Acemoglu and Johnson’s skepticism on this topic, I think there is a real basis for guarded optimism.
In short, Acemoglu and Johnson have given us much to think about in this book. It didn’t go everywhere I would have liked to see it go, but that’s what happens when you talk about a thousand years.
[1] I was very happy to see Johnson and Simon take up one of my recurring themes in this area, Section 230 protection for Internet platforms. This both allows for platforms to have inordinate power in shaping our politics and allows for their shareholders and top execs to get rich. They go in a somewhat different direction for a remedy. I would take away the protection for sites that relied on advertising or selling personal information, requiring platforms to respond to takedown notices, as is currently the case with allegations of copyright infringement. They would take it away for promoting incendiary material, but the key point is that we need a serious discussion on the matter, which has not taken place to date.
Read More Leer más Join the discussion Participa en la discusión
Read More Leer más Join the discussion Participa en la discusión
The debt whiners are out in full force these days as we face the risk of default at the start of next month. We hear them complain endlessly about the burden we are imposing on future generations. If we imagine for a moment that any of these people actually care about the future (anyone hear of global warming?), we should ask why none of them ever says anything about the burden of patent and copyright monopolies?
This may be too simple for great minds, but the granting of patent and copyright monopolies is a mechanism that the government uses to pay for innovation and creative work. It is an alternative to direct government spending. The government could directly pay companies for innovating and producing movies, writing books, and performing music, but instead it gives these companies monopolies that allow them to charge far more than the free market price for the duration of a patent or copyright.
In the case of prescription drugs, pharmaceutical companies will often charge ten or even 100 times the free market price of a drug for the period in which it holds a patent monopoly. This means that a drug that might sell for $10-$20 a prescription, instead sells for hundreds or thousands of dollars per prescription. There is a similar story with a wide range of other items, like medical equipment, seed, fertilizers, and pesticide. Patent monopolies make items expensive, that would otherwise be cheap.
The same is true of copyright. We could costlessly copy and transfer books, music, movies, software and many other types of creative work over the web, if it were not for the copyright monopolies granted by the government.
We can debate the merits of patents and copyrights as government mechanisms for financing innovation and creative work, but we can’t deny that they impose a large cost. Arguably, the higher prices we pay as a result of these monopolies comes to over $1 trillion a year, close to half of all after-tax corporate profits.
In the case of prescription drugs alone, patent monopolies and related protections will likely cost us over $400 billion this year. We will spend over $550 billion for drugs that would probably cost us less than $100 billion in a free market without government granted patent monopolies (National Income and Product Accounts, Table 2.4.5U, Line 121). By contrast, we are projected to spend $663 billion in interest payments on the debt. If we added in the higher costs due to patent and copyright monopolies on other items, it would almost certainly dwarf the interest payments on the debt.
It is bizarre that people who endlessly obsess about the burden of the debt literally never talk about the burdens created by government-granted patent and copyright monopolies. This failure to address this massive burden created by government policy might cause one to question the sincerity of their concern about the burden of the debt.
Read More Leer más Join the discussion Participa en la discusión
Maybe I’ve missed it, but I have seen very little mention of import prices in discussions of the current and future course of inflation. That seems a bit odd, both because the volume of imports is large relative to the economy and there seems to be quite a story here.
On the first point, imports are currently running at a bit less than 15.0 percent of GDP. That is a big deal if we think of imports as inputs into final products, like the imported steel in the cars that we manufacture here.
However, it is probably an even bigger deal in the context of competition with domestic products. While the relationship is not one to one, if the price of competing imports of clothes, appliances, or other items rises by 5.0 percent, then we can assume that U.S. producers will look to raise their prices by a comparable amount. The same story applies to falling prices.
This gets us to the interesting story. We all know about the big jump in inflation as the economy reopened following the pandemic. We saw a comparable picture with import prices.
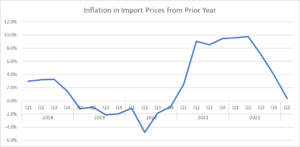
Source: Bureau of Economic Analysis and author’s calculations.
As can be seen, year over year inflation in import prices originally fell at the start of the pandemic, going from an annual rate of around -1.0 percent to -4.8 percent in the second quarter of 2020, when the economy was largely shut down. Then import prices turned around and began to rise rapidly. The year over year rate of inflation was close to or above 9.0 percent every quarter from the second quarter of 2021 to the second quarter of 2022.
However, the quarterly change in import prices turned negative in the third quarter of last year. The year over year rate of inflation for the first quarter of 2023 was just 0.4 percent, and it is likely to be negative in the current quarter.
This doesn’t guarantee the soft landing that many of us are hoping for, but it is a big factor pushing in the right direction. Over a long period, we can expect the rate of inflation to be roughly equal to the rate of hourly wage growth, minus the rate of productivity growth. But insofar as rate of increase in import prices is less than this rate, it will pull down the rate of domestic inflation somewhat.
And, with imports close to 15 percent of GDP, the impact is large enough to matter. Just to show the simple arithmetic, if import prices rise 2.0 percentage points less than the inflation rate implied by the wages minus productivity calculation, that would knock 0.3 percentage points off the inflation rate.
The real world is of course more complicated than this arithmetic implies. Nonetheless, imports are a big enough factor in the economy that the rate of inflation in import prices will affect our domestic inflation rate. And, in 2021 and the first half of 2022, they were a big factor fueling domestic inflation. They are now a factor restraining domestic inflation.
Maybe I’ve missed it, but I have seen very little mention of import prices in discussions of the current and future course of inflation. That seems a bit odd, both because the volume of imports is large relative to the economy and there seems to be quite a story here.
On the first point, imports are currently running at a bit less than 15.0 percent of GDP. That is a big deal if we think of imports as inputs into final products, like the imported steel in the cars that we manufacture here.
However, it is probably an even bigger deal in the context of competition with domestic products. While the relationship is not one to one, if the price of competing imports of clothes, appliances, or other items rises by 5.0 percent, then we can assume that U.S. producers will look to raise their prices by a comparable amount. The same story applies to falling prices.
This gets us to the interesting story. We all know about the big jump in inflation as the economy reopened following the pandemic. We saw a comparable picture with import prices.
Source: Bureau of Economic Analysis and author’s calculations.
As can be seen, year over year inflation in import prices originally fell at the start of the pandemic, going from an annual rate of around -1.0 percent to -4.8 percent in the second quarter of 2020, when the economy was largely shut down. Then import prices turned around and began to rise rapidly. The year over year rate of inflation was close to or above 9.0 percent every quarter from the second quarter of 2021 to the second quarter of 2022.
However, the quarterly change in import prices turned negative in the third quarter of last year. The year over year rate of inflation for the first quarter of 2023 was just 0.4 percent, and it is likely to be negative in the current quarter.
This doesn’t guarantee the soft landing that many of us are hoping for, but it is a big factor pushing in the right direction. Over a long period, we can expect the rate of inflation to be roughly equal to the rate of hourly wage growth, minus the rate of productivity growth. But insofar as rate of increase in import prices is less than this rate, it will pull down the rate of domestic inflation somewhat.
And, with imports close to 15 percent of GDP, the impact is large enough to matter. Just to show the simple arithmetic, if import prices rise 2.0 percentage points less than the inflation rate implied by the wages minus productivity calculation, that would knock 0.3 percentage points off the inflation rate.
The real world is of course more complicated than this arithmetic implies. Nonetheless, imports are a big enough factor in the economy that the rate of inflation in import prices will affect our domestic inflation rate. And, in 2021 and the first half of 2022, they were a big factor fueling domestic inflation. They are now a factor restraining domestic inflation.
Read More Leer más Join the discussion Participa en la discusión
Read More Leer más Join the discussion Participa en la discusión
• Budget and National DebtDebtEconomic Crisis and RecoveryCrisis económica y recuperaciónUnited StatesEE. UU.

Read More Leer más Join the discussion Participa en la discusión