


Many people are aware of the increase the number of people insured as a result of the Affordable Care Act. Some also know about the slower rate of growth of health care costs. (Yes folks, that is slower growth in costs, not a decline — no one promised a miracle.) Anyhow, it is worth putting these two together to see the pattern in health care costs per insured person under Obamacare. Here’s the picture.
Source: Bureau of Economic Analysis and Centers for Disease Control and Prevention.
As can be seen, there is a sharp slowing in the rate of growth of health care costs per person in 2010, just as the Affordable Care Act is passed into law. In the years from 1999 to 2010, health care costs per insured person rose at an average annual rate of 5.7 percent. In the years from 2010 to 2015 costs per insured person rose at an average rate of just 2.3 percent.
Undoubtedly, the ACA is not the full explanation for the slowdown in cost growth, but it certainly contributed to the slowdown. Furthermore, as a political matter, does anyone doubt for a second that if cost growth had accelerated that the ACA would be given the blame even if there was no evidence that it was a major factor?
Anyhow, this is a good story. It doesn’t mean anyone should be happy with our health care system as it is now. We pay ridiculous sums for prescription drugs that would be cheap in a free market. Our doctors are paid twice as much as their counterparts in other wealthy countries. And, the insurance industry is a major source of needless waste. But the health care system is much better today than it was when President Obama took office, and that is a big deal.
Note: I realize that some folks are getting the wrong graph with this post. The correct one (which shows up on my computers) is an index of health care costs per insured person with 1999 set equal to 100. I have no idea where the other graph came from, but we will investigate.
Read More Leer más Join the discussion Participa en la discusión
The reason for asking is that the Congressional Budget Office (CBO) has recently put out some very pessimistic projections for Social Security. These projections got some attention from the media because they were considerably more pessimistic than the projections from the Social Security Trustees, implying a somewhat larger gap between projected benefit payments and projected revenue.
While most of the attention was on the differences in the program’s finances, what actually would mean more to most people is the difference in projected wage growth between the two programs. The CBO projections show a considerably slower path of wage growth than the Social Security trustees projections.
The main reason for this difference is that CBO projects that wage income will be further redistributed upward over the next decade, while the trustees project a small reversal of some of the upward redistribution of the last three decades. While the share of wage income that went over the taxable cap (currently $118,500) was just 10 percent in 1980, this had risen to 18 percent by 2015. This is one of the main reasons that Social Security’s finances look worse now than had been projected three decades ago.
CBO projects that the share of wage income going to those earning above the cap (@ 6.0 percent of workers) will increase to more than 22 percent by 2026. This worsens the finances of the program, since it is not collected taxes on this money, but more importantly it means that most workers will see little wage growth over the next decade. The figure below shows average real wage growth projected by CBO for the next decade (Figure 2-9 from the Budget and Economic Outlook) and the average for the bottom 94 percent of wage earners.
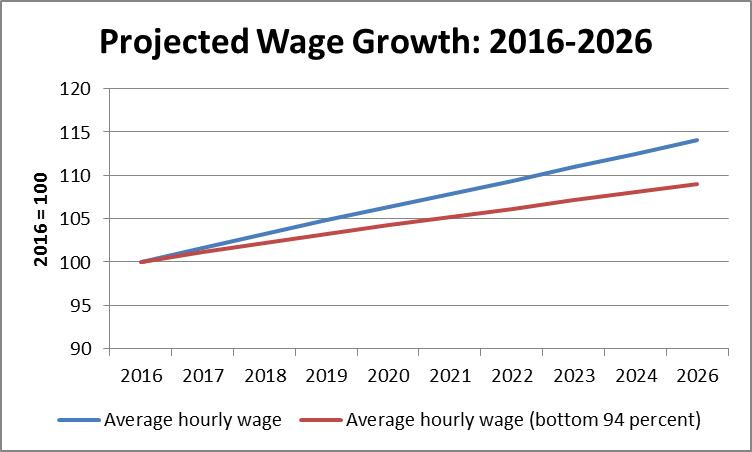 Source: Congressional Budget Office and author’s calculations.
The CBO projections imply that real wages will rise by an average of 9.0 percent over the next decade for bottom 94 percent of workers. The upward redistribution projected by CBO would cost the typical worker just over 4.4 percent of their wages. This means that for a worker who would otherwise be earning $50,000 in 2026 (in 2016 dollars), the upward redistribution projected by CBO will mean a loss of wages of $2,200, so that they would only be earning $47,800.
As a practical matter, most workers are likely to do considerably worse under the CBO scenario. If past trends continue, the workers closer to the taxable cap (e.g. the 90th percentile worker) are likely to see somewhat higher wage growth than workers near the middle and bottom of the wage distribution. In other words, the CBO projections imply that most workers will see little or no wage growth over the next decade as the overwhelming majority of wage gains go to those at the top of the income distribution.
This should be of great concern to Hillary Clinton since she has committed herself to pushing through an agenda that ensures most workers share in the benefits of wage growth. The CBO projections imply that this is clearly not the case and the projected upward redistribution of income will matter much more to workers’ living standards than any conceivable increase in Social Security taxes — even if the media will do their best to ensure that the public only hears about the taxes.
The reason for asking is that the Congressional Budget Office (CBO) has recently put out some very pessimistic projections for Social Security. These projections got some attention from the media because they were considerably more pessimistic than the projections from the Social Security Trustees, implying a somewhat larger gap between projected benefit payments and projected revenue.
While most of the attention was on the differences in the program’s finances, what actually would mean more to most people is the difference in projected wage growth between the two programs. The CBO projections show a considerably slower path of wage growth than the Social Security trustees projections.
The main reason for this difference is that CBO projects that wage income will be further redistributed upward over the next decade, while the trustees project a small reversal of some of the upward redistribution of the last three decades. While the share of wage income that went over the taxable cap (currently $118,500) was just 10 percent in 1980, this had risen to 18 percent by 2015. This is one of the main reasons that Social Security’s finances look worse now than had been projected three decades ago.
CBO projects that the share of wage income going to those earning above the cap (@ 6.0 percent of workers) will increase to more than 22 percent by 2026. This worsens the finances of the program, since it is not collected taxes on this money, but more importantly it means that most workers will see little wage growth over the next decade. The figure below shows average real wage growth projected by CBO for the next decade (Figure 2-9 from the Budget and Economic Outlook) and the average for the bottom 94 percent of wage earners.
Source: Congressional Budget Office and author’s calculations.
The CBO projections imply that real wages will rise by an average of 9.0 percent over the next decade for bottom 94 percent of workers. The upward redistribution projected by CBO would cost the typical worker just over 4.4 percent of their wages. This means that for a worker who would otherwise be earning $50,000 in 2026 (in 2016 dollars), the upward redistribution projected by CBO will mean a loss of wages of $2,200, so that they would only be earning $47,800.
As a practical matter, most workers are likely to do considerably worse under the CBO scenario. If past trends continue, the workers closer to the taxable cap (e.g. the 90th percentile worker) are likely to see somewhat higher wage growth than workers near the middle and bottom of the wage distribution. In other words, the CBO projections imply that most workers will see little or no wage growth over the next decade as the overwhelming majority of wage gains go to those at the top of the income distribution.
This should be of great concern to Hillary Clinton since she has committed herself to pushing through an agenda that ensures most workers share in the benefits of wage growth. The CBO projections imply that this is clearly not the case and the projected upward redistribution of income will matter much more to workers’ living standards than any conceivable increase in Social Security taxes — even if the media will do their best to ensure that the public only hears about the taxes.
Read More Leer más Join the discussion Participa en la discusión
Read More Leer más Join the discussion Participa en la discusión
That’s right, Friedman is actually supporting measures that would help to reverse the upward redistribution of the last four decades. In his column today Friedman identifies himself as a citizen “who believes that America needs a healthy center-right party that offers more market-based solutions to problems; keeps the pressure on for deregulation, freer trade and smaller government.”
Of course, reducing the length and strength of patent and copyright monopolies would be a big step towards freer trade. If we paid free market prices for prescription drugs instead of today’s protected prices, we would save in the neighborhood of $360 billion a year (@ 2.0 percent of GDP).
Currently, doctors have to complete a residency program in the United States to practice medicine here. If we replaced this requirement with one designed to ensure that doctors practicing in the United States were competent, it could save us around $100 billion annually in medical expenses.
As can be seen, there are enormous potential gains to the public from freer trade. It’s good to see Friedman’s interest in turning policy in that direction. It would be nice if people in positions of political power shared his point of view.
Read More Leer más Join the discussion Participa en la discusión
Most sectors within manufacturing have seen serious downsizing and restructuring over the last four decades. Many have gone bankrupt. Much of this story was not pretty for the workers directly affected. Many lost the only good-paying jobs they ever held. Some also lost pensions and health care benefits.
Nonetheless, the conventional wisdom among economists was that this process was good. It was associated with growing efficiency in the manufacturing sector as the least productive firms went out of business, other firms became more productive in order to survive. The net effect was that we are able to buy a wide range of manufactured goods for much lower prices than would be the case if the manufacturing sector had not gone through this period of downsizing and transition.
With this as background, it was striking to see the Wall Street Journal bemoaning what appears to be a comparable period of adjustment in the banking industry. The central point is that the banking industry appears to be less profitable than it was before the crisis. Apparently tighter regulations are playing a major role in this decline in profitability.
This drop in profitability is presented as a bad thing, but it is hard to see why those of us outside of the banking industry should see it that way. If the sector had become badly bloated prior to the crisis then we should want to see it downsized. The workers who lose their jobs can be redeployed to sectors where they will be more productive. (The same argument that economists gave for manufacturing firms.) Declining profitability is a necessary part of this story.
Maybe the banks will also stop paying their CEOs tens of millions of dollars to issue phony accounts to customers. Lower pay for CEOs and other top executives will leave more money for shareholders.
There is a risk that the bankruptcy of a major bank could cause a serious disruption to the economy. Of course, that would imply that we still need to be concerned about “too big to fail” banks, in spite of the endless assurances to the contrary. If we have in fact fixed the too big to fail problem, then the rest of us should be celebrating the downsizing of the banking industry as the market working its magic. Too bad the WSJ doesn’t like the market.
Read More Leer más Join the discussion Participa en la discusión
Read More Leer más Join the discussion Participa en la discusión
Read More Leer más Join the discussion Participa en la discusión
The NYT had its second major article in less than a month on the alleged mistreatment of a small public pension fund by the California Public Employee Retirement System (Calpers). The focus of this piece is the bill that the small California town of Loyalton faces from terminating its pension plan for four retirees and converting to a 401(k) system. According to the piece, the city council apparently did not understand the information Calpers gave it on termination costs when it voted in 2012 to end its pension with Calpers. This is unfortunate, but it is not clear that the council’s confusion is an appropriate topic for a major NYT piece.
The prior piece discussed problems involving pensions for six workers for Citrus Pest Control District No. 2. They discovered that there would be substantial costs associated with terminating their participation in Calpers and switching to a 401(k) pension. While that piece, like this one, implied that Calpers has been doing something improper; in fact, the system has provided all the appropriate information to its participants.
It is certainly plausible that these very small systems with no professional administrators may not understand the information given to them by Calpers. In this case, the problem is a lack of sophistication on the part of the people managing these small funds, not Calpers.
Of course, this is the argument as to why a defined benefit system like Calpers is better than a 401(k) type system where individuals have to make their own investment decisions. Most people are not financially sophisticated. As a result they often make bad choices in managing their money. This is especially likely when people pushing various funds are in a position to make large fees by promoting bad choices.
It is striking that the NYT has now devoted a large amount of space to the problems facing a total of ten workers in the California Public Employees Retirement System. It might be appropriate for it to shift its focus to the tens of millions of workers without adequate retirement plans.
Read More Leer más Join the discussion Participa en la discusión
Read More Leer más Join the discussion Participa en la discusión
Read More Leer más Join the discussion Participa en la discusión


