


• Intellectual PropertyPropiedad IntelectualUnited StatesEE. UU.

The New York Times had a piece reporting on the conditions the Biden administration intends to impose on companies that benefit from the subsidies in the CHIPS Act, which is intended to increase domestic production of advanced semiconductors and related technologies. It noted that one of the conditions is a tax on excess profits, defined as profits in excess of some target specified by the companies getting the subsidies.
This proposed tax seems a recipe for endless legal wrangling. Companies constantly restructure, creating, eliminating, or selling subsidiaries. It will likely be extremely difficult to show that a company actually earned more than they were supposed to from a specific subsidy. In any case, we know this route will create lots of high-paying jobs for tax lawyers and accountants, which is a complete waste from the standpoint of economic efficiency.
A more productive route would be to change the terms of the intellectual property that these companies will be getting due to the subsidies. As it is now, patent monopolies extend for 20 years from the date of issuance.
A condition of getting the subsidy could be that the length of the patent is substantially shorter, say four years. This should give companies plenty of time to take advantage of technology developed through these subsidies, especially since they would enjoy an enormous first-mover advantage that would continue even after their monopolies had expired.
This shorter period should encompass other protections, most notably non-disclosure agreements. Workers who developed the technology could not be prevented from going to competitors or starting their own company for more than four years after the subsidy was received.
While there will still be disputes about what technology was actually developed with the subsidy, this route has two major advantages. First, it provides dividends to the public through lower prices rather than tax revenue. This will mean more take-up of the product. It also should foster further innovation since competitors can quickly build on important breakthroughs rather than bottling them up in a single company.
The other advantage is that the government doesn’t have to play the role of enforcer. If the issue is the patent length that should apply, a company’s competitors are likely to press the case for themselves. If they want to use a technology or hire away key employers, they would look to move forward and force the company to go to court to try to block them.
The threat of legal action can still be an effective deterrent, but with substantial profits at stake, many companies will likely be prepared to take the risk. In any case, this is likely to be a far less bureaucratic process than determining how much a company’s profits exceeded its projected levels.
Read More Leer más Join the discussion Participa en la discusión
Many people who should know better have been saying silly things about households running down their savings and being forced to cut back consumption. The problem with these sorts of comments is that savings in our national income accounts have little to do with how most of us think about savings in our lives. Less of the former does not necessarily mean that people will have less money to buy things.
Before going into the specifics, let me just make a point to orient people. Saving in the national income accounts is almost entirely a story of the top half of the income distribution, and largely the top 10 percent.
I recognize that there are tens of millions of people who are struggling to get by, and in many cases not getting by. These people are either not saving at all or, insofar as they are, it has a minimal impact on aggregate saving numbers. The saving rate is not about their story.
Aggregate saving is about the people who have the money and the choice of whether to spend it or not. That is not a good picture, it would be great if we had a far more equal distribution of income so that most people did have the option to save, but we don’t. In an economy where the richest 10 percent of households get more than 40 percent of income, aggregate savings is the story of what these people are doing with their money.
Saving by Burning Money
The key point in this story is the definition of savings in the national income accounts. Savings is simply disposable income (income minus taxes) that is not spent on consumption. From the standpoint of the national income accounts, it doesn’t matter what you did with the money that you didn’t spend on consumption. As long as you didn’t spend it on the consumption of a newly produced good or service, it is treated as being saved.
Savings includes all of the things people typically do with their money that we would think of as saving. So, putting money in the bank counts as saving, as does buying a government bond. Buying shares of stock or a plot of land would also count as saving. We may colloquially describe these purchases as “investment” but we are not buying a newly produced good or service, we are just trading assets (cash for shares of stock or a deed to land), so these purchases do not count as investment in the national income accounts.
People may also save in ways that they don’t think of as saving. If they cashed their paycheck and put a few hundred dollars aside to buy a television or some other appliance, but didn’t get around to doing it, then they have saved this money from the standpoint of the national income accounts.
The same would be the case if they pulled a few hundred dollars out of the bank that they intended to spend but somehow lost the money. If the money remains lost, it is saved from a national accounting standpoint.
This is even true if they deliberately destroyed the money. If someone cashes their paycheck and then burns $1,000 to protest George Santos being in Congress, this will be treated as savings in the national income accounts. They did not buy a newly produced good or service.
Capital Gains are Not Income, Therefore They Don’t Increase Savings
If saving is defined as income that is not spent on a newly produced good or service, then we also need a definition of income. Income in the national income accounts is money generated from services provided in the current year. Most obviously, this would be the wages people get from working. It would also be rent paid on land or housing. It also would include interest and dividends paid on bonds or shares of stock.
However, the capital gains on stock do not count as income. (The same applies to capital gains on houses.) The idea here is that stock prices fluctuate month to month and year to year. If we envision a situation where we had the exact same stock of capital on January 1, 2023, as we did on January 1, 2022, and the same labor force, but the value of the market was 10 percent greater (roughly $4 trillion), there would be no asset (tangible or intangible) that corresponds to this $4 trillion increase in value. Therefore, it does not count as income.
If that sounds strange, consider the opposite situation where the market falls by 10 percent over the course of a year. Would it make sense to deduct $4 trillion from national income as a result?
This is important in the current context because many people sold stock after the large pandemic run-up in the market, and have substantial capital gains as a result. Suppose that a household has a normal income of $200,000 from wages. (Yes, this is a rich household.) If they sold stock last year for $300,000, with a capital gain of $100,000, they would have lots of money in the bank.
However, from the standpoint of the national income accounts, their income is still just $200,000. If their consumption was unchanged, then their measured saving would be the same in the year they realized these capital gains as it had been before.
Actually, the situation is somewhat worse than this. They are supposed to pay capital gains tax on this money. If they pay capital gains tax at the 20 percent rate, then they will pay an additional $20,000 in income taxes as a result of their capital gains.[1] This would reduce their disposable income, which is defined as income, minus taxes.
If their consumption is unchanged, their savings would be $20,000 lower because their after-tax income is $20,000 lower. For the country as a whole, if we have a large sell-off of stock after a big run-up, we will see an increase in taxes, which will mean a lower saving rate, other things equal. We did in fact see a big jump in tax payments in 2022, which explains most but not all, of the drop in savings last year. (The saving rate rose in January, despite the big jump in consumption, due to a sharp drop in tax payments.)
The other part of the story is that households may increase their consumption based on their capital gains. If they used some of their gains to remodel their house, buy a new car, or take a vacation, this would mean they have increased their consumption and reduced their savings. Undoubtedly, this is part of the story of the decline in savings reported for 2022.
This is not sustainable in the sense that we would not expect households will have large amounts of capital gains to draw on every year. But this is not a story of households drawing down their savings in any meaningful sense. If the household with the $100,000 gain, spent on extra $20,000 on one-time expenditures, after paying an extra $20,000 in capital gains taxes, their reported savings would be $40,000 lower than in the prior year, but they would still have $260,000 in the bank from selling their stock. This is to a large extent the story of the decline in the saving rate that we saw in 2022.
Dividends and Share Buybacks: An Inconsistency in the National Income Accounts
While households cannot anticipate large capital gains every year, corporate share buybacks is one case where this view would be wrong. The basic story is that share buybacks are a way for companies to give out money to shareholders as an alternative to paying dividends. Buybacks are desirable from the standpoint of shareholders since the money paid out is not immediately subject to taxes, as is the case with dividends. Shareholders will only pay taxes when they sell the stock at a gain.
This situation leads to an inconsistency in the national income accounts. Suppose corporations pay out $200 billion in dividends to shareholders. This money counts as income for shareholders and as an expense for the companies, which reduces their profits and corporate savings.
However, if they instead pay out this $200 billion by buying back shares, this money is not treated as income for shareholders. That is true even if the shareholders immediately sell their stock and take advantage of the higher prices resulting from the buybacks. From the companies’ standpoint, this $200 billion in buybacks does not count as an expense and reduce their profits. Instead, it is treated as though they purchased an asset (their own stock), just as if they had bought land or shares in another company.
This matters when we look at household saving rates since companies can in fact indefinitely pay out the money that would otherwise go to dividends, in the form of share buybacks. For consistency, we really should count this money as part of household income. This would raise disposable income and therefore increase savings.
The Whole Picture
The figure below shows the reported saving rate from the national income accounts from 2015 to 2023. It also shows the ratio of saving, plus taxes, to total income in the years since 2015. While the Trump tax cut did change this relationship in 2017 and 2018, since 2019 we have had no major changes to the tax code. That means that changes in the relationship between tax collections and income were driven mostly by changes in household income, most notably capital gains income. (There were timing issues associated with the pandemic, but using annual data eliminates most of this effect.)
The third line uses a measure of savings if we count share buybacks as part of personal income. This adds dollar to dollar to savings, since its inclusion does not affect consumption. It also raises income (the denominator), since we have to add share buybacks to the measure of personal income in the National Accounts.
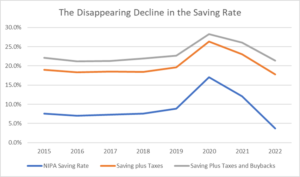
Source: BEA, S&P, and author’s calculations.
As can be seen, including personal taxes (Table 2.1, Line 6) eliminates most of the drop in saving reported for 2023. While the official saving rate shows a drop of 3.6 percentage points from the average for the four years prior to the pandemic to 2023 (7.3 percent to 3.7 percent), using the combined taxes plus savings measure the drop is just 0.7 percentage points (18.6 percent to 17.9 percent). Calculating a saving rate that includes share buybacks as income, there is a drop of just 0.3 percentage points (21.7 percent to 21.4 percent).
In short, if we use measures of saving that are more consistent with both what households actually see, and economic logic, there is very little to the idea that the saving rate is falling through the floor. The plunging saving rate is almost entirely an illusion caused by the failure to think about the issue clearly.
[1] Much of these gains would in fact be taxed at a rate lower than 20 percent for a family earning $200k.
Many people who should know better have been saying silly things about households running down their savings and being forced to cut back consumption. The problem with these sorts of comments is that savings in our national income accounts have little to do with how most of us think about savings in our lives. Less of the former does not necessarily mean that people will have less money to buy things.
Before going into the specifics, let me just make a point to orient people. Saving in the national income accounts is almost entirely a story of the top half of the income distribution, and largely the top 10 percent.
I recognize that there are tens of millions of people who are struggling to get by, and in many cases not getting by. These people are either not saving at all or, insofar as they are, it has a minimal impact on aggregate saving numbers. The saving rate is not about their story.
Aggregate saving is about the people who have the money and the choice of whether to spend it or not. That is not a good picture, it would be great if we had a far more equal distribution of income so that most people did have the option to save, but we don’t. In an economy where the richest 10 percent of households get more than 40 percent of income, aggregate savings is the story of what these people are doing with their money.
Saving by Burning Money
The key point in this story is the definition of savings in the national income accounts. Savings is simply disposable income (income minus taxes) that is not spent on consumption. From the standpoint of the national income accounts, it doesn’t matter what you did with the money that you didn’t spend on consumption. As long as you didn’t spend it on the consumption of a newly produced good or service, it is treated as being saved.
Savings includes all of the things people typically do with their money that we would think of as saving. So, putting money in the bank counts as saving, as does buying a government bond. Buying shares of stock or a plot of land would also count as saving. We may colloquially describe these purchases as “investment” but we are not buying a newly produced good or service, we are just trading assets (cash for shares of stock or a deed to land), so these purchases do not count as investment in the national income accounts.
People may also save in ways that they don’t think of as saving. If they cashed their paycheck and put a few hundred dollars aside to buy a television or some other appliance, but didn’t get around to doing it, then they have saved this money from the standpoint of the national income accounts.
The same would be the case if they pulled a few hundred dollars out of the bank that they intended to spend but somehow lost the money. If the money remains lost, it is saved from a national accounting standpoint.
This is even true if they deliberately destroyed the money. If someone cashes their paycheck and then burns $1,000 to protest George Santos being in Congress, this will be treated as savings in the national income accounts. They did not buy a newly produced good or service.
Capital Gains are Not Income, Therefore They Don’t Increase Savings
If saving is defined as income that is not spent on a newly produced good or service, then we also need a definition of income. Income in the national income accounts is money generated from services provided in the current year. Most obviously, this would be the wages people get from working. It would also be rent paid on land or housing. It also would include interest and dividends paid on bonds or shares of stock.
However, the capital gains on stock do not count as income. (The same applies to capital gains on houses.) The idea here is that stock prices fluctuate month to month and year to year. If we envision a situation where we had the exact same stock of capital on January 1, 2023, as we did on January 1, 2022, and the same labor force, but the value of the market was 10 percent greater (roughly $4 trillion), there would be no asset (tangible or intangible) that corresponds to this $4 trillion increase in value. Therefore, it does not count as income.
If that sounds strange, consider the opposite situation where the market falls by 10 percent over the course of a year. Would it make sense to deduct $4 trillion from national income as a result?
This is important in the current context because many people sold stock after the large pandemic run-up in the market, and have substantial capital gains as a result. Suppose that a household has a normal income of $200,000 from wages. (Yes, this is a rich household.) If they sold stock last year for $300,000, with a capital gain of $100,000, they would have lots of money in the bank.
However, from the standpoint of the national income accounts, their income is still just $200,000. If their consumption was unchanged, then their measured saving would be the same in the year they realized these capital gains as it had been before.
Actually, the situation is somewhat worse than this. They are supposed to pay capital gains tax on this money. If they pay capital gains tax at the 20 percent rate, then they will pay an additional $20,000 in income taxes as a result of their capital gains.[1] This would reduce their disposable income, which is defined as income, minus taxes.
If their consumption is unchanged, their savings would be $20,000 lower because their after-tax income is $20,000 lower. For the country as a whole, if we have a large sell-off of stock after a big run-up, we will see an increase in taxes, which will mean a lower saving rate, other things equal. We did in fact see a big jump in tax payments in 2022, which explains most but not all, of the drop in savings last year. (The saving rate rose in January, despite the big jump in consumption, due to a sharp drop in tax payments.)
The other part of the story is that households may increase their consumption based on their capital gains. If they used some of their gains to remodel their house, buy a new car, or take a vacation, this would mean they have increased their consumption and reduced their savings. Undoubtedly, this is part of the story of the decline in savings reported for 2022.
This is not sustainable in the sense that we would not expect households will have large amounts of capital gains to draw on every year. But this is not a story of households drawing down their savings in any meaningful sense. If the household with the $100,000 gain, spent on extra $20,000 on one-time expenditures, after paying an extra $20,000 in capital gains taxes, their reported savings would be $40,000 lower than in the prior year, but they would still have $260,000 in the bank from selling their stock. This is to a large extent the story of the decline in the saving rate that we saw in 2022.
Dividends and Share Buybacks: An Inconsistency in the National Income Accounts
While households cannot anticipate large capital gains every year, corporate share buybacks is one case where this view would be wrong. The basic story is that share buybacks are a way for companies to give out money to shareholders as an alternative to paying dividends. Buybacks are desirable from the standpoint of shareholders since the money paid out is not immediately subject to taxes, as is the case with dividends. Shareholders will only pay taxes when they sell the stock at a gain.
This situation leads to an inconsistency in the national income accounts. Suppose corporations pay out $200 billion in dividends to shareholders. This money counts as income for shareholders and as an expense for the companies, which reduces their profits and corporate savings.
However, if they instead pay out this $200 billion by buying back shares, this money is not treated as income for shareholders. That is true even if the shareholders immediately sell their stock and take advantage of the higher prices resulting from the buybacks. From the companies’ standpoint, this $200 billion in buybacks does not count as an expense and reduce their profits. Instead, it is treated as though they purchased an asset (their own stock), just as if they had bought land or shares in another company.
This matters when we look at household saving rates since companies can in fact indefinitely pay out the money that would otherwise go to dividends, in the form of share buybacks. For consistency, we really should count this money as part of household income. This would raise disposable income and therefore increase savings.
The Whole Picture
The figure below shows the reported saving rate from the national income accounts from 2015 to 2023. It also shows the ratio of saving, plus taxes, to total income in the years since 2015. While the Trump tax cut did change this relationship in 2017 and 2018, since 2019 we have had no major changes to the tax code. That means that changes in the relationship between tax collections and income were driven mostly by changes in household income, most notably capital gains income. (There were timing issues associated with the pandemic, but using annual data eliminates most of this effect.)
The third line uses a measure of savings if we count share buybacks as part of personal income. This adds dollar to dollar to savings, since its inclusion does not affect consumption. It also raises income (the denominator), since we have to add share buybacks to the measure of personal income in the National Accounts.
Source: BEA, S&P, and author’s calculations.
As can be seen, including personal taxes (Table 2.1, Line 6) eliminates most of the drop in saving reported for 2023. While the official saving rate shows a drop of 3.6 percentage points from the average for the four years prior to the pandemic to 2023 (7.3 percent to 3.7 percent), using the combined taxes plus savings measure the drop is just 0.7 percentage points (18.6 percent to 17.9 percent). Calculating a saving rate that includes share buybacks as income, there is a drop of just 0.3 percentage points (21.7 percent to 21.4 percent).
In short, if we use measures of saving that are more consistent with both what households actually see, and economic logic, there is very little to the idea that the saving rate is falling through the floor. The plunging saving rate is almost entirely an illusion caused by the failure to think about the issue clearly.
[1] Much of these gains would in fact be taxed at a rate lower than 20 percent for a family earning $200k.
Read More Leer más Join the discussion Participa en la discusión
The January data on consumer expenditures released yesterday had many people freaking out. The story is that the Fed is going to have to get out the big guns to really shoot inflation down.
For those of us hoping that inflation would come down, without a big jump in unemployment, the report was definitely bad news. It showed strong growth in consumption, and more troubling, a 0.6 monthly increase in both the overall Personal Consumption Expenditure Deflator (PCE) and the core.
Many of us had expected a modest uptick from December’s 0.4 percent core, but the 0.2 percentage point jump was definitely disconcerting. So, the story in yesterday’s data was definitely bad news from the standpoint of moderating inflation, but we have to remember the fourteenth commandment, never make too much of a single month’s data.[1]
How Bad Is It?
First, on the demand side, the answer is pretty straightforward. As I noted when the January retail sales were released, the January jump was making up for declines reported in November and December. A 1.8 percent single month’s jump in consumption expenditures (1.1 percent real) sure looks like a big deal. But, if we take the increase over the last three months it is not much to get excited about.
The annual growth rate in nominal sales from October to January was 6.0 percent. If we take my preferred measure, comparing the last three months (November, December, and January) with the prior three months (August, September, and October), the nominal growth rate was just 4.2 percent. The corresponding growth rates in real consumption expenditures are 1.9 percent for October through January and 0.6 percent for the average of the last three months compared with the prior three months. It would be difficult to argue that these growth rates are unsustainable.
There is a question as to why we saw this quirky pattern, with very weak numbers in November and December, followed by an extraordinarily strong number in January. Part of the story is likely problems with seasonal adjustments. If people move their holiday purchases forward, say into October, then the seasonal adjustments would make November and December look weaker than they really are. This would also imply some automatic bounce back in the January data since the December sales had been understated.
It is also possible that January really was very strong, as we had better than normal weather in much of the country. That could have led people to do more shopping and buy more items than they would have if we had seen a typical January with snow storms and cold weather in the Midwest and Northeast. (That could also help explain the big jump in employment reported for the month.)
In either case, there is little basis in the January data for thinking that consumption is increasing at an unsustainable pace. If we see strong growth again in February, then we would have to reassess this view, but the January data taken in the context of prior months does not provide much reason for thinking that consumption is growing especially fast.
What About Prices?
If the reported surge in consumption can be easily dismissed, that is not true with the price data reported for January. Inflation looked to be clearly slowing through the fall, then we saw a 0.4 percent rise in the core rate in the PCE in December, followed by this 0.6 percent jump. That gave us a 4.7 percent annualized increase over the last three months and a slightly better 4.1 percent rate taking the average of the last three months compared with the prior three months. This is still down considerably from the peaks hit in the first half of 2022, but the downward trend is far less clear.
The reversal is partly due to new seasonal adjustment factors which now show higher inflation rates for the fall months than what had previously been reported. This makes inflation in recent months look worse, but does have the offsetting benefit that the seasonal adjustments will tend to lower inflation more in the months ahead. Still, if we are mistaken about the downward trend, seasonal adjustments will not give us one.
Comparing the 0.6 percent increase in the core in January with the relatively modest 0.2 percent rise in November, there are large differences in most components. For simplicity, we can divide the core into three main areas, rent, core goods, and services.
The Certain Decline in Rental Inflation
The story with rent is the simplest. The rent proper component rose 0.74 percent in January, down slightly from its 0.77 percent rise in November. Owners’ equivalent rent edged up very slightly from a 0.66 percent increase in November to a 0.67 percent increase in January. Clearly, this is not the story of the more rapid inflation in January.
This rate of rental inflation would be a cause for concern, but we know that it will soon turn sharply lower, based on the much lower rate of rental inflation shown in private indexes of marketed units. Later this year, we will likely be seeing rates of rental inflation that are comparable to or lower than their pre-pandemic pace.
Furthermore, pandemic supply chain problems slowed the construction of new units. There are now more units, especially in apartment buildings, under construction than when the Fed began raising rates last March. As these units get completed, it should put further downward pressure on rents.
For these reasons, we can be confident that rent will not be a major contributor to inflation later this year. That is a big deal since it accounts for most of the 40 percent of the core CPI and just under 17 percent of the core PCE deflator. If rent is not pushing inflation higher, and quite possibly pulling it lower, the picture will look considerably better in future months.
The Prospect for Price Declines in Non-Core Goods
The situation with services and core goods is more complex. Prices of the latter were pushed higher in 2021 and the first half of 2022 due to supply chain issues. This was the story of ships backed up at docks, unable to offload their cargo. There was also was a semi-conductor shortage due to a fire at a major factory in Japan, which led to a serious shortage of cars and trucks, sending their prices soaring.
Prices for many of these items had been falling in the summer and fall, but have stabilized or even edged higher in the last couple of months. This raises the question of whether prices have now adjusted to a new post-pandemic normal, or whether we should expect further price declines in the months ahead.
A way to gauge this is to compare pre-pandemic price trends, with where prices are today, adjusting for excess wage growth. I define the latter as the wage growth since the pandemic that exceeds the pace of wage growth for the prior five years.
The average hourly wage increased at a 5.1 percent annual rate in the three years from January 2020 to January 2023, compared to a pre-pandemic trend of 2.8 percent. As a result, wages were 6.9 percent higher last month, on average, than if they had continued at their pre-pandemic pace. The pre-pandemic trend for prices is defined as the rate of price growth in the five years prior to the pandemic.
The figure below shows current price levels for new and used vehicles, appliances, furniture, and vehicle parts. It compares the current price level, using the CPI, with the price level if the pre-pandemic trend had persisted, adding in 6.9 percent to account for the excess wage growth since the start of the pandemic.
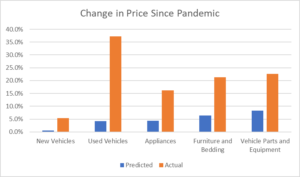
Source: Bureau of Labor Statistics and author’s calculations.
As can be seen, in all of these categories the actual price change has far exceeded the one predicted by extrapolating from trends and excess wage growth. (This pattern does not hold for all commodities. For apparel the actual price change since the pandemic was 5.4 percent, compared to the 5.1 percent increase that would be predicted by this formula.) For four of the five categories, the gap is more than 10 percentage points and in the case of used vehicles, it is more than 30 percentage points.
The predicted values are obviously based on a very crude calculation. However, when we are through all the pandemic and Ukraine war-related supply chain issues, we should expect to see the pattern for prices to return to something like their pre-pandemic trend path unless the pandemic permanently altered conditions of production or competition.
The large remaining gap between actual prices and predicted prices suggests that we should still expect substantial future declines in many areas where they were sharp rises in prices during the pandemic. The timing will vary depending on specific conditions in each industry. For example, auto manufacturers are still reporting that shortages of chips and other parts are impeding production. These shortages are much less severe now than last year, but it is not clear when production will be able to return to normal levels.
In other cases, production is likely to close to normal but it is a question of how long it takes for inventories to build up and then place downward pressure on prices. This has already happened in the case of televisions. After rising by 13.2 percent between August 2020 and August 2021, television prices have since fallen back by almost 20 percent and are now well below the pre-pandemic level. With the ratio of non-car inventories to sales now at or above pre-pandemic levels, we should expect further price declines in many commodities in the not-distant future.
Non-Rent Services
Federal Reserve Board Chair Jerome Powell has indicated that he is closely watching the trend in non-core services. These are areas like health care services, transportation services, and restaurants. The story here in the January data is clearly not good.
The price of health care services in the PCE rose 0.26 percent in January, after rising by 0.12 percent in December and just 0.07 percent in November. The price for transportation services rose by 1.05 percent in January, and the index for restaurants rose by 0.64 percent. There is a similar story with most other non-rent services.
However, there are two important reasons not to be too scared by these numbers. The first is that the price increases in services are at least partially driven by increases in goods prices. In the case of transportation, higher fuel prices are a big factor in airline prices. Also, the pandemic-related surge in the price of vehicle parts is a big factor in the price of car repair services. In the same vein, soaring food prices are a big factor in restaurant prices.
If these prices stabilize, and likely turn downward in many cases, the lower costs will be reflected in service prices. That doesn’t mean we may not see a problem of the excessive inflation in non-rent services, but we should recognize that at least part of the inflation we are seeing at present is due to increases in goods prices that will not continue.
The other, more important, issue is that inflation in services should ultimately be consistent with the pace of wage growth we are seeing. This simply means that we should not expect the capital share to either rise or fall indefinitely. And, since we saw a big shift from wages to profits in the pandemic, it would be reasonable to expect some period where the wage share increases at the expense of profits.
The rate of wage growth has fallen considerably over the course of 2022. The Employment Cost Index (ECI) rose at less than a 4.0 percent annual rate in the 4th quarter, down from a 5.8 percent rate in the first quarter. The annual rate of growth in the average hourly earnings (AHE) series for the three months that ended in January was 4.6 percent, down from a peak in this measure of 6.4 percent in January of 2022.
Monthly, and even quarterly data, are erratic, but it is clear that the direction of change is downward. In spite of the low unemployment rate and the high reported rate of job openings, wage growth has been slowing. There is no guarantee this slowing will continue, but there is no doubt about the direction of change over the last year.
The other point is that these rates of wage growth would suggest a slower pace of inflation in services going forward. While the pace of productivity growth is another big question mark, given past patterns, we should assume that inflation in services will be 1.0 to 1.5 percentage points less than the rate of wage growth. This would give us inflation in services of between 2.5 percent and 3.0 percent, based on the ECI, and 3.1 percent and 3.6 percent based on the AHE.
Are We Getting to the Fed’s Target?
Taking these stories together, we may still be looking at inflation somewhat above 2.0 percent through 2023, but it is likely that we will be getting close. If the rate of rental inflation falls to between 2.0-3.0 percent (slightly below the pre-pandemic pace), we see a period of falling non-core goods prices, and we have inflation in non-housing services of nearly 3.0 percent, we would be looking at an overall inflation rate of less than 3.0 percent. Whether we get close enough to 2.0 for the Fed to decide that it has done its job will depend on both the actual inflation rate and how the Fed interprets its 2.0 percent target.
I recognize that I have been consistently optimistic about the inflation picture since the early days of the pandemic recovery, so it is worth questioning my assumptions here. Perhaps the big pandemic price rises in goods will stick, implying a lasting shift to profits in this area. It is also possible that we will be in for a stretch of extraordinarily weak productivity growth in services, which would also mean more inflation. It could also be the case that wage growth will begin to accelerate again.
These are all real possibilities, which along with other factors could lead inflation to come in considerably higher than my calculations here. But, there is at least a plausible scenario that suggests that we will be close to the Fed’s inflation target by the end of 2023, without a big rise in unemployment.
It is indisputable that we have already seen a sharp slowing of inflation and wage growth even as unemployment has fallen to a fifty-year low. It is hard to see how we can rule out the possibility that this trend will continue.
[1] I am happy to say that the Wednesday release of 3rd quarter data from the Quarterly Census on Employment and Wages (QCEW), coupled with yesterday’s release from the Commerce Department, restored my confidence in the establishment survey. Noting the huge gap between job growth as reported in the establishment survey and employment growth in the household survey, I actually considered the possibility that the household survey was closer to the mark. However, the 3rd quarter QCEW hugely outpaced the reported job growth in the establishment survey for the quarter, putting the combined 2nd and 3rd quarter numbers for the two series within spitting distance of each other. The receipts on social insurance taxes reported in yesterday’s release, which come from the Treasury Department, fit closely with the big jump in employment reported in the establishment survey for January. With these important independent data sources looking pretty close to the establishment data, we can be comfortable that it is giving us a reasonably good picture of the labor market.
The January data on consumer expenditures released yesterday had many people freaking out. The story is that the Fed is going to have to get out the big guns to really shoot inflation down.
For those of us hoping that inflation would come down, without a big jump in unemployment, the report was definitely bad news. It showed strong growth in consumption, and more troubling, a 0.6 monthly increase in both the overall Personal Consumption Expenditure Deflator (PCE) and the core.
Many of us had expected a modest uptick from December’s 0.4 percent core, but the 0.2 percentage point jump was definitely disconcerting. So, the story in yesterday’s data was definitely bad news from the standpoint of moderating inflation, but we have to remember the fourteenth commandment, never make too much of a single month’s data.[1]
How Bad Is It?
First, on the demand side, the answer is pretty straightforward. As I noted when the January retail sales were released, the January jump was making up for declines reported in November and December. A 1.8 percent single month’s jump in consumption expenditures (1.1 percent real) sure looks like a big deal. But, if we take the increase over the last three months it is not much to get excited about.
The annual growth rate in nominal sales from October to January was 6.0 percent. If we take my preferred measure, comparing the last three months (November, December, and January) with the prior three months (August, September, and October), the nominal growth rate was just 4.2 percent. The corresponding growth rates in real consumption expenditures are 1.9 percent for October through January and 0.6 percent for the average of the last three months compared with the prior three months. It would be difficult to argue that these growth rates are unsustainable.
There is a question as to why we saw this quirky pattern, with very weak numbers in November and December, followed by an extraordinarily strong number in January. Part of the story is likely problems with seasonal adjustments. If people move their holiday purchases forward, say into October, then the seasonal adjustments would make November and December look weaker than they really are. This would also imply some automatic bounce back in the January data since the December sales had been understated.
It is also possible that January really was very strong, as we had better than normal weather in much of the country. That could have led people to do more shopping and buy more items than they would have if we had seen a typical January with snow storms and cold weather in the Midwest and Northeast. (That could also help explain the big jump in employment reported for the month.)
In either case, there is little basis in the January data for thinking that consumption is increasing at an unsustainable pace. If we see strong growth again in February, then we would have to reassess this view, but the January data taken in the context of prior months does not provide much reason for thinking that consumption is growing especially fast.
What About Prices?
If the reported surge in consumption can be easily dismissed, that is not true with the price data reported for January. Inflation looked to be clearly slowing through the fall, then we saw a 0.4 percent rise in the core rate in the PCE in December, followed by this 0.6 percent jump. That gave us a 4.7 percent annualized increase over the last three months and a slightly better 4.1 percent rate taking the average of the last three months compared with the prior three months. This is still down considerably from the peaks hit in the first half of 2022, but the downward trend is far less clear.
The reversal is partly due to new seasonal adjustment factors which now show higher inflation rates for the fall months than what had previously been reported. This makes inflation in recent months look worse, but does have the offsetting benefit that the seasonal adjustments will tend to lower inflation more in the months ahead. Still, if we are mistaken about the downward trend, seasonal adjustments will not give us one.
Comparing the 0.6 percent increase in the core in January with the relatively modest 0.2 percent rise in November, there are large differences in most components. For simplicity, we can divide the core into three main areas, rent, core goods, and services.
The Certain Decline in Rental Inflation
The story with rent is the simplest. The rent proper component rose 0.74 percent in January, down slightly from its 0.77 percent rise in November. Owners’ equivalent rent edged up very slightly from a 0.66 percent increase in November to a 0.67 percent increase in January. Clearly, this is not the story of the more rapid inflation in January.
This rate of rental inflation would be a cause for concern, but we know that it will soon turn sharply lower, based on the much lower rate of rental inflation shown in private indexes of marketed units. Later this year, we will likely be seeing rates of rental inflation that are comparable to or lower than their pre-pandemic pace.
Furthermore, pandemic supply chain problems slowed the construction of new units. There are now more units, especially in apartment buildings, under construction than when the Fed began raising rates last March. As these units get completed, it should put further downward pressure on rents.
For these reasons, we can be confident that rent will not be a major contributor to inflation later this year. That is a big deal since it accounts for most of the 40 percent of the core CPI and just under 17 percent of the core PCE deflator. If rent is not pushing inflation higher, and quite possibly pulling it lower, the picture will look considerably better in future months.
The Prospect for Price Declines in Non-Core Goods
The situation with services and core goods is more complex. Prices of the latter were pushed higher in 2021 and the first half of 2022 due to supply chain issues. This was the story of ships backed up at docks, unable to offload their cargo. There was also was a semi-conductor shortage due to a fire at a major factory in Japan, which led to a serious shortage of cars and trucks, sending their prices soaring.
Prices for many of these items had been falling in the summer and fall, but have stabilized or even edged higher in the last couple of months. This raises the question of whether prices have now adjusted to a new post-pandemic normal, or whether we should expect further price declines in the months ahead.
A way to gauge this is to compare pre-pandemic price trends, with where prices are today, adjusting for excess wage growth. I define the latter as the wage growth since the pandemic that exceeds the pace of wage growth for the prior five years.
The average hourly wage increased at a 5.1 percent annual rate in the three years from January 2020 to January 2023, compared to a pre-pandemic trend of 2.8 percent. As a result, wages were 6.9 percent higher last month, on average, than if they had continued at their pre-pandemic pace. The pre-pandemic trend for prices is defined as the rate of price growth in the five years prior to the pandemic.
The figure below shows current price levels for new and used vehicles, appliances, furniture, and vehicle parts. It compares the current price level, using the CPI, with the price level if the pre-pandemic trend had persisted, adding in 6.9 percent to account for the excess wage growth since the start of the pandemic.
Source: Bureau of Labor Statistics and author’s calculations.
As can be seen, in all of these categories the actual price change has far exceeded the one predicted by extrapolating from trends and excess wage growth. (This pattern does not hold for all commodities. For apparel the actual price change since the pandemic was 5.4 percent, compared to the 5.1 percent increase that would be predicted by this formula.) For four of the five categories, the gap is more than 10 percentage points and in the case of used vehicles, it is more than 30 percentage points.
The predicted values are obviously based on a very crude calculation. However, when we are through all the pandemic and Ukraine war-related supply chain issues, we should expect to see the pattern for prices to return to something like their pre-pandemic trend path unless the pandemic permanently altered conditions of production or competition.
The large remaining gap between actual prices and predicted prices suggests that we should still expect substantial future declines in many areas where they were sharp rises in prices during the pandemic. The timing will vary depending on specific conditions in each industry. For example, auto manufacturers are still reporting that shortages of chips and other parts are impeding production. These shortages are much less severe now than last year, but it is not clear when production will be able to return to normal levels.
In other cases, production is likely to close to normal but it is a question of how long it takes for inventories to build up and then place downward pressure on prices. This has already happened in the case of televisions. After rising by 13.2 percent between August 2020 and August 2021, television prices have since fallen back by almost 20 percent and are now well below the pre-pandemic level. With the ratio of non-car inventories to sales now at or above pre-pandemic levels, we should expect further price declines in many commodities in the not-distant future.
Non-Rent Services
Federal Reserve Board Chair Jerome Powell has indicated that he is closely watching the trend in non-core services. These are areas like health care services, transportation services, and restaurants. The story here in the January data is clearly not good.
The price of health care services in the PCE rose 0.26 percent in January, after rising by 0.12 percent in December and just 0.07 percent in November. The price for transportation services rose by 1.05 percent in January, and the index for restaurants rose by 0.64 percent. There is a similar story with most other non-rent services.
However, there are two important reasons not to be too scared by these numbers. The first is that the price increases in services are at least partially driven by increases in goods prices. In the case of transportation, higher fuel prices are a big factor in airline prices. Also, the pandemic-related surge in the price of vehicle parts is a big factor in the price of car repair services. In the same vein, soaring food prices are a big factor in restaurant prices.
If these prices stabilize, and likely turn downward in many cases, the lower costs will be reflected in service prices. That doesn’t mean we may not see a problem of the excessive inflation in non-rent services, but we should recognize that at least part of the inflation we are seeing at present is due to increases in goods prices that will not continue.
The other, more important, issue is that inflation in services should ultimately be consistent with the pace of wage growth we are seeing. This simply means that we should not expect the capital share to either rise or fall indefinitely. And, since we saw a big shift from wages to profits in the pandemic, it would be reasonable to expect some period where the wage share increases at the expense of profits.
The rate of wage growth has fallen considerably over the course of 2022. The Employment Cost Index (ECI) rose at less than a 4.0 percent annual rate in the 4th quarter, down from a 5.8 percent rate in the first quarter. The annual rate of growth in the average hourly earnings (AHE) series for the three months that ended in January was 4.6 percent, down from a peak in this measure of 6.4 percent in January of 2022.
Monthly, and even quarterly data, are erratic, but it is clear that the direction of change is downward. In spite of the low unemployment rate and the high reported rate of job openings, wage growth has been slowing. There is no guarantee this slowing will continue, but there is no doubt about the direction of change over the last year.
The other point is that these rates of wage growth would suggest a slower pace of inflation in services going forward. While the pace of productivity growth is another big question mark, given past patterns, we should assume that inflation in services will be 1.0 to 1.5 percentage points less than the rate of wage growth. This would give us inflation in services of between 2.5 percent and 3.0 percent, based on the ECI, and 3.1 percent and 3.6 percent based on the AHE.
Are We Getting to the Fed’s Target?
Taking these stories together, we may still be looking at inflation somewhat above 2.0 percent through 2023, but it is likely that we will be getting close. If the rate of rental inflation falls to between 2.0-3.0 percent (slightly below the pre-pandemic pace), we see a period of falling non-core goods prices, and we have inflation in non-housing services of nearly 3.0 percent, we would be looking at an overall inflation rate of less than 3.0 percent. Whether we get close enough to 2.0 for the Fed to decide that it has done its job will depend on both the actual inflation rate and how the Fed interprets its 2.0 percent target.
I recognize that I have been consistently optimistic about the inflation picture since the early days of the pandemic recovery, so it is worth questioning my assumptions here. Perhaps the big pandemic price rises in goods will stick, implying a lasting shift to profits in this area. It is also possible that we will be in for a stretch of extraordinarily weak productivity growth in services, which would also mean more inflation. It could also be the case that wage growth will begin to accelerate again.
These are all real possibilities, which along with other factors could lead inflation to come in considerably higher than my calculations here. But, there is at least a plausible scenario that suggests that we will be close to the Fed’s inflation target by the end of 2023, without a big rise in unemployment.
It is indisputable that we have already seen a sharp slowing of inflation and wage growth even as unemployment has fallen to a fifty-year low. It is hard to see how we can rule out the possibility that this trend will continue.
[1] I am happy to say that the Wednesday release of 3rd quarter data from the Quarterly Census on Employment and Wages (QCEW), coupled with yesterday’s release from the Commerce Department, restored my confidence in the establishment survey. Noting the huge gap between job growth as reported in the establishment survey and employment growth in the household survey, I actually considered the possibility that the household survey was closer to the mark. However, the 3rd quarter QCEW hugely outpaced the reported job growth in the establishment survey for the quarter, putting the combined 2nd and 3rd quarter numbers for the two series within spitting distance of each other. The receipts on social insurance taxes reported in yesterday’s release, which come from the Treasury Department, fit closely with the big jump in employment reported in the establishment survey for January. With these important independent data sources looking pretty close to the establishment data, we can be comfortable that it is giving us a reasonably good picture of the labor market.
Read More Leer más Join the discussion Participa en la discusión
• Affordable Care ActEconomic Crisis and RecoveryCrisis económica y recuperaciónHealth and Social ProgramsLos Programas Sociales y de SaludHealthcareSocial SecurityUnited StatesEE. UU.

Guess so since it gave Brian Riedl, a senior fellow at the Manhattan Institute, plenty of space to say things that are extremely deceptive, if not outright lies. The gist of Riedl’s piece is that it will not be possible to sustain Social Security and Medicare without tax increases on the middle class.
Much of the piece is the standard line about an aging population posing an impossible burden that we have been reading about in the NYT and elsewhere for many decades. For example, Riedl includes an old favorite:
The ratio of workers supporting each retiree, which was about 5:1 back in 1960, will fall to just over 2:1 by the next decade.
This is, of course, largely true. The deceptive part is that most of the decline in the ratio of workers to retirees took place long ago. The ratio of covered workers to beneficiaries had dropped to 3.2:1 by 1975. It hovered around this level until the baby boomers began to retire at the end of the first decade of the century.
The ratio of workers to retirees is now down to 2.8 to 1. It is projected to fall to 2.4 to 1 by the next decade. Are you scared yet?
Riedl also tells us, “people who live until age 90, a fast-growing group, will spend one-third of their adult life collecting Social Security and Medicare benefits.” There are two problems with this assertion.
First, the people who live to 90 will be disproportionately higher-income workers. Many will have delayed collecting Social Security benefits until they are age 70, or close to it. Also, if they continue working and have employer-provided health insurance, Medicare will not be the primary payer until they retire. If “adult life” starts at age 18, then we are looking at people who live to age 90 collecting benefits for a bit more than a quarter of their adult life (20 years out of 72 years).
But the more important point is that life expectancies have not increased for everyone. As a recent report from the Congressional Research Service documented, there has been almost no increase in life expectancy at age 65 for workers in the bottom half of the income distribution. The story of increasing life expectancies is overwhelming, a story of higher income workers living longer.
Getting Beyond Deception
Riedl also tells us that “today’s typical retiring couple will receive Medicare benefits three times as large as their lifetime contributions to the system.” This is true, but it leaves out two important points.
First, the reason that the value of Medicare benefits is so high is that we pay twice as much for our health care, per person, as people in other wealthy countries. This is not due to better care. People in the United States do not do better by most outcome measures.
Our higher costs are the result of the fact that we pay twice as much for everything. We pay the drug companies twice as much for prescription drugs. We pay the medical equipment manufacturers twice as much for medical equipment. We pay our doctors twice as much as doctors in Europe and Canada. And, we throw hundreds of billions annually at insurance companies because they have powerful lobbyists who can get them these handouts. Our expensive Medicare benefits are not a story of the elderly living the high life, they are a story of powerful interest groups ripping off the healthcare system.
But these are just the standard deceptions we have come to expect since the days when private equity billionaire Peter Peterson was leading the charge against Social Security and Medicare. But the other problem with Reidl’s Medicare comment gets to the outright lie part.
Unlike Social Security, Medicare is not designed as a system where a dedicated tax is supposed to fully fund the program. Traditional Medicare has three parts: Part A is the hospital insurance portion of the program, which is supposed to be paid from the dedicated Medicare tax. Part B covers doctors’ payments. This is only designed to be partially funded by premiums paid by beneficiaries. Part D is for drug coverage, which is also designed to be only partially funded by beneficiary premiums. (There is also Part C, Medicare Advantage, which is intended as a way to funnel money to insurance companies.)
Since much of the Medicare program is not even designed to be covered by payments directly to the program, it makes no sense to include these portions of the program in complaints about Medicare’s deficit. When Riedl tells us that Medicare is projected to run a $48 trillion shortfall over the next three decades, the overwhelming majority of this projected shortfall is due to a portion of the program that is not covered by Medicare-specific taxes by design.
It is comparable to telling us that the Defense Department is running an $890 billion deficit this year (3.4 percent of GDP), because that is the extent to which its spending will exceed its designated taxes. I assume that the NYT would not allow the piece complaining about the huge Defense Department deficit on its opinion page because it makes no sense. Why is this complaint about the Medicare deficit allowed?
There actually is a very interesting story about the projected deficit for the Medicare Part A program: it has fallen sharply in recent decades. In 2000, it was projected that Medicare would face a shortfall of 0.4 percent of GDP (around $90 billion a year) by now, rising to 1.0 percent of GDP by 2040 (Table III.C1). The most recent Trustees Report shows a shortfall of just 0.04 percent of GDP this year, rising to 0.42 percent in 2040 and then falling through the rest of the century.
This improvement in the program’s finances is due to the sharp slowing of healthcare cost growth. Needless to say, if we got our health care costs in line with costs in countries like Germany and Canada, the program would be showing an enormous surplus. The Affordable Care Act played a role in curbing healthcare cost growth over this period. President Biden is trying to go further with his proposals to limit drug costs if Republican “deficit hawks” don’t stand in his way.
Do We Have to Tax the Middle Class?
There are two further points work making on Reidl’s piece. First, there is an issue that Social Security will soon need additional revenue beyond what is projected to come from its designated payroll tax. This can come, at least in part, from raising taxes on higher-income earners. The tax is not collected on wage income above $160k.
When this cutoff was set in 1982, only 10 percent of wage income was above the cap. As a result of the upward redistribution of income over the last four decades, close to 18 percent of wage income is above this cutoff. Subjecting a larger portion of the wages of high-income earners to the tax would help to close the projected shortfall.
We could also turn to other taxes, such as taxes on non-wage income or higher corporate income taxes. This would move away from the practice of funding benefits from the dedicated Social Security tax, but it’s not clear many people would be bothered by this shift.
It is also worth noting that in prior decades we did raise the Social Security tax rate repeatedly. The Social Security tax was increased over the five decades following its inception, from 2.0 percent in 1937 to 12.4 percent in 1990. It has not increased at all in more than 30 years.
As I noted yesterday, it was possible politically to increase taxes so much in part because, at least through the first thirty-five years of the program’s existence, real wages were rising at a healthy pace. Taxing away a portion of the wage gains workers receive every year is an easier matter than asking workers to give up a portion of paychecks that are stagnant or even declining in real terms.
It appears that real wages are back on an upward path. Beginning in the middle of the last decade, real wages were rising at a rate of close to 1.0 percent annually for the typical worker. Pandemic inflation briefly stopped this growth, but it appears that real wages are again rising, especially for those in the bottom portion of the wage ladder. If this trend continues, modest increases in Social Security taxes should be a possibility if that proves necessary.
The other issue is that we may not need additional taxes at all, at least from a macroeconomic standpoint. Many economists, most notably former Treasury Secretary Larry Summers, have argued that the biggest problem facing an aging society is “secular stagnation.” This is a story where there is not enough demand to keep the economy operating at its potential and to keep workers fully employed. This is 180 degrees at odds with the story that we won’t have the resources needed to support a growing elderly population. If Summers’ secular stagnation view proves correct, then there would be no reason to have tax increases since the economy is suffering from too little demand, not too much.
In short, the fear lobby is up to its old tricks, which genuinely serious people (as opposed to “very serious people”) have been combatting for decades. Social Security and Medicare are great success stories that tens of millions of people depend upon. We should not allow dishonest scare stories to be a basis for slashing and/or privatizing these programs.
Read More Leer más Join the discussion Participa en la discusión
The New York Times had an interesting piece on aging societies in Asia and elsewhere. The piece rightly points out that as the elderly comprise a larger share of the population, societies will have to make adjustments to meet their needs. This is not some sort of crisis, as it is often portrayed, by rather a challenge that has to be recognized, similar to other challenges posed by past demographic changes.
The NYT piece noted that older people are likely to need more medical care than younger adults. Also, many will face chronic conditions like dementia, which will be difficult to deal with, especially for those without children or other family members to help them. It also pointed out that many older people are forced to work late in life because they don’t have a sufficient income on which to retire.
These are real and important problems, but this will not be the first time that demographics has created a burden for the country. Specifically, the baby boomers imposed a major burden on the country when we were young.
The baby boom cohorts flooded the schools in the years from 1950 to 1982, leading to an enormous increase in spending on elementary and secondary education. In 1946, before any baby boomers had entered kindergarten, government at all levels spent less than 1.3 percent of GDP on K-12 education. This figure rose rapidly through the 1950s and 1960s, peaking at 3.8 percent of GDP in 1970. It then leveled off and edged slightly downward in the 1970s and early 1980s as the cohorts that followed the baby boom were somewhat smaller. This pattern is shown below.
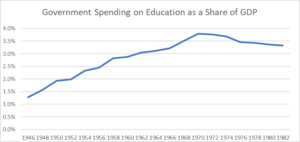
Source: Bureau of Economic Analysis and Statistical Abstract.
This increase in spending on K-12 education of 2.5 percentage points of GDP over 24 years is considerably larger than the 1.8 percentage point projected increase in spending on Social Security in the forty years from 2000 to 2040. Also, as many began to attend college in the mid-sixties, there was an even larger increase, in own percent, in spending on college education, by both government and households.
Of course, the huge influx of baby boomers into schools created problems. I remember my second grade class in Chicago had fifty kids. They also put mobile classrooms into our playground, since the school had more kids enrolled than the building could accommodate. And, there were tax increases to cover the costs of educating more children.
And, paying for schools was just the start of it. Young children had to be looked after. At the time, formal child care was rare, so this responsibility typically fell to parents (generally mothers) and other relatives.
Responsibility for raising children kept tens of millions of women out of the labor force. In the 1950s, labor force participation rates for women between the ages of 20 to 24 averaged around 45 percent. Currently, they are over 70 percent. For women between the ages of 25 to 34, labor force participation rates rose from the mid-40s in the 1950s to peaks of over 78 percent in recent years. This translated into hundreds of millions of lost work years from the standpoint of the paid labor market.
In short, the baby boom cohorts imposed a major burden on both the government and families when they were young. Nonetheless, the decades of the 1950s and 1960s were periods of general prosperity, which saw rapid economic growth that was widely shared across the income distribution. Dealing with an enormous growth in a dependent population of young children did not prevent substantial economic progress.
The Burden of An Aging Population
This short discussion of the baby boomers’ youth is helpful in thinking about the burden posed by an aging population. Just as was the case with the young baby boomers, we will have to reallocate resources to meet the needs of aging baby boomers. It is far from an impossible burden if dealt with intelligently, but clearly it will impose costs.
Most immediately we will have to divert a large share of national income to support a growing population of retirees. We are already far along this path. The increase in the share of GDP going to Social Security between 2000 and 2023 is larger than the projected increase between 2023 and 2040, so this is clearly a manageable burden.
There is an issue that the Social Security trust fund is projected to face a shortfall starting in a bit more than a decade. This is a problem of allocation, not a direct drain of resources. The amount of resources needed to support the elderly population is determined by the number of elderly. We have been meeting this burden without major strains for well over a decade. Our economy can continue to do so, however, we have to decide how to allocate money to the Social Security program.
We can do that with designated taxes, as we have done since the program was created, or we can allocate money from general revenue. This is a political choice, but from an economic standpoint we clearly have the resources to pay benefits.
There is also a question of whether the benefits should be raised. The New York Times piece described incidents where elderly people were doing physically demanding jobs, presumably because they could not afford to retire. A modest increase in Social Security benefits (10-20 percent), for lower income retirees, would carry a relatively small price tag. This would make a large difference in the retirement prospects for lower paid workers, and mean that fewer would be forced to continue working late in life or when they are in bad health.
It would also help enormously if we could have serious discussions of tax increases, and not just for richest one percent. (We should definitely increase their taxes.) The Social Security tax was increased repeatedly over the five decades following its inception, from 2.0 percent in 1937 to 12.4 percent in 1990. It has not been increased at all in more than thirty years.
Part of the reason it was possible politically to increase taxes so much was that, at least through the first thirty-five years of the program’s existence, real wages were rising at a healthy pace. Taxing away a portion of the wage gains workers receive every year is an easier matter than asking workers to give up a portion of paychecks that are stagnant or even declining.
Fortunately, it appears that real wages are back on an upward path. Beginning in the middle of the last decade, real wages were rising at a rate of close to 1.0 percent annually for the typical worker. Pandemic inflation briefly stopped this growth, but it appears that real wages are again rising, especially for those in the bottom portion of the wage ladder. If this trend continues, modest increases in Social Security taxes should be a possibility, if that proves necessary.[1]
Getting Health Care Costs Under Control
A big part of the story of making the burden of an aging population manageable is getting our health care costs under control. The scare stories of the economy being crushed by a flood of retiring baby boomers were actually more a story of exploding health care costs than an increase in the ratio of retirees to workers. The proponents of the scare stories were simply being dishonest. Unfortunately, because of their standing in policy circles, their scare stories were taken seriously by the media.[2]
Fortunately, health care costs have not risen anywhere near as much as projected. In fact, in the last few years they have actually fallen slightly as a share of GDP. Nonetheless, we still pay more than twice as much per person as the average for other wealthy country countries. If we can get our health care costs closer to OECD average, it will make it far easier to care for a growing elderly population.
The basic story of our health care is that we pay far more for just about everything than people in other wealthy countries. The most glaring difference is with prescription drugs, where we often pay two or three times as much, for the same drug, as people in Europe and Canada.
The reason for this disparity is that we give drug companies patent monopolies, or related protections, and then, unlike any other country, tell the drug companies they can charge whatever they want. Every other wealthy country has some sort of price regulation that goes along with these government-granted monopolies.
We can get our prices down by adopting the same sort of restrictions on patent monopolies that Europe and Canada have. We will spend around $550 billion this year on prescription drugs. This is equal to 2.2 percent of GDP or more than 60 percent of the military budget. If we got our prices down to European levels we would pay around half of this amount. There is a similar story with medical equipment, although we only spend around $200 billion a year there.
Even better than reducing our payments for patent-protected drugs, we can stop relying on patent monopoly financing altogether for the development of new drugs. We can pay for the research upfront, as we did with the development of Moderna’s Covid vaccine. (We also allowed them to maintain a monopoly on the vaccine, in effect paying them twice.)
The government already spends over $50 billion a year on biomedical research through the National Institutes of Health. We could substantially increase the amount of public funding, but add the provision that all the drugs, vaccines, and other products developed must be fully open-source, so that they could be sold as cheap generics from the day they are approved.
We already have a great example of this model. Peter Hotez and Elena Bottazzi, two highly respected researchers at Baylor University and Texas Children’s Hospital, developed a simple to produce, 100 percent open-source Covid vaccine. It uses well-established technologies that are not complicated (unlike mRNA). Their vaccine has been widely used in India and Indonesia, with over 100 million people getting the vaccine to date.
Their vaccine sells for less than $2 a dose in India. If the FDA were to approve it here (it would likely cost around $10 million for the clinical trials needed to get approval) it would probably sell for less than $5 a shot. This compares to $110 to $130 dollars that Pfizer and Moderna want to charge for their boosters. If we got 100,000 people to take the Hotez-Bottazzi vaccine rather than the Pfizer-Moderna shot, it would cover the cost of the trials. If we got 1 million to take their vaccine it would cover the cost ten times over, and if ten million people took their vaccine it would cover the cost one hundred times over.
It is not just money we would save by going this open-source route. The huge markups that drug companies can charge due to patent monopolies give them an enormous incentive to lie about the safety and effectiveness of their drugs. We see this problem all the time, most notably with the opioid crisis where drug companies deceived doctors about the addictiveness of their drugs.
Another prominent example is the Alzheimer’s drug Adulhelm. Biogen, the manufacturer of the drug, was pushing the FDA for an accelerated approval, in spite of limited evidence of its effectiveness and serious harmful side effects. Their plan was thwarted after the resignation of several members of an FDA advisory committee. Biogen had planned to sell the drug for $56,000 for a year’s treatment. If Adulhelm was developed with open-source funding, and would be sold as a cheap generic upon approval, there would have been little incentive to try to get the FDA to ignore concerns about the drug’s safety and effectiveness.
Open-source drugs would also have a substantial impact on income inequality. The people who benefit from patent monopolies and related protections are almost all in the top 10 percent of the income distribution and many are in the top one percent. Forbes magazine calculated that the Moderna vaccine alone created five billionaires.
Aging Is a Distraction
We should recognize that the aging of the population will pose problems, but these problems are not qualitatively different, and almost certainly smaller in size, than the problems created by the baby boom cohorts when they were young. These problems are dwarfed by the problems created by inequality.
They are also aggravated by inequality. In a less unequal society, tens of millions of people would approach old age in better health. This is not only good for them, but it also means that paying for their health care would require fewer resources than if we continue on our current track.
Obviously, those who benefit from the extreme inequality we see at present would prefer that policy instead be focused on aging, as though this is a crisis. But their interests do not change the reality.
[1] Many economists, most notably former Treasury Secretary Larry Summers, have argued that the biggest problem facing an aging society is “secular stagnation.” This is a story where there is not enough demand to keep the economy operating at its potential and to keep workers fully employed. This is 180 degrees at odds with the story that we won’t have the resources needed to support a growing elderly population. If Summers’ secular stagnation view proves correct, then there would be no reason to have tax increases, since the economy is suffering from too little demand, not too much.
[2] The classic work in this vein was Peter Peterson’s mid-nineties gem, Will America Grow Up Before It Grows Old: How the Coming Social Security Crisis Threatens You, Your Family, and Your Country.
The New York Times had an interesting piece on aging societies in Asia and elsewhere. The piece rightly points out that as the elderly comprise a larger share of the population, societies will have to make adjustments to meet their needs. This is not some sort of crisis, as it is often portrayed, by rather a challenge that has to be recognized, similar to other challenges posed by past demographic changes.
The NYT piece noted that older people are likely to need more medical care than younger adults. Also, many will face chronic conditions like dementia, which will be difficult to deal with, especially for those without children or other family members to help them. It also pointed out that many older people are forced to work late in life because they don’t have a sufficient income on which to retire.
These are real and important problems, but this will not be the first time that demographics has created a burden for the country. Specifically, the baby boomers imposed a major burden on the country when we were young.
The baby boom cohorts flooded the schools in the years from 1950 to 1982, leading to an enormous increase in spending on elementary and secondary education. In 1946, before any baby boomers had entered kindergarten, government at all levels spent less than 1.3 percent of GDP on K-12 education. This figure rose rapidly through the 1950s and 1960s, peaking at 3.8 percent of GDP in 1970. It then leveled off and edged slightly downward in the 1970s and early 1980s as the cohorts that followed the baby boom were somewhat smaller. This pattern is shown below.
Source: Bureau of Economic Analysis and Statistical Abstract.
This increase in spending on K-12 education of 2.5 percentage points of GDP over 24 years is considerably larger than the 1.8 percentage point projected increase in spending on Social Security in the forty years from 2000 to 2040. Also, as many began to attend college in the mid-sixties, there was an even larger increase, in own percent, in spending on college education, by both government and households.
Of course, the huge influx of baby boomers into schools created problems. I remember my second grade class in Chicago had fifty kids. They also put mobile classrooms into our playground, since the school had more kids enrolled than the building could accommodate. And, there were tax increases to cover the costs of educating more children.
And, paying for schools was just the start of it. Young children had to be looked after. At the time, formal child care was rare, so this responsibility typically fell to parents (generally mothers) and other relatives.
Responsibility for raising children kept tens of millions of women out of the labor force. In the 1950s, labor force participation rates for women between the ages of 20 to 24 averaged around 45 percent. Currently, they are over 70 percent. For women between the ages of 25 to 34, labor force participation rates rose from the mid-40s in the 1950s to peaks of over 78 percent in recent years. This translated into hundreds of millions of lost work years from the standpoint of the paid labor market.
In short, the baby boom cohorts imposed a major burden on both the government and families when they were young. Nonetheless, the decades of the 1950s and 1960s were periods of general prosperity, which saw rapid economic growth that was widely shared across the income distribution. Dealing with an enormous growth in a dependent population of young children did not prevent substantial economic progress.
The Burden of An Aging Population
This short discussion of the baby boomers’ youth is helpful in thinking about the burden posed by an aging population. Just as was the case with the young baby boomers, we will have to reallocate resources to meet the needs of aging baby boomers. It is far from an impossible burden if dealt with intelligently, but clearly it will impose costs.
Most immediately we will have to divert a large share of national income to support a growing population of retirees. We are already far along this path. The increase in the share of GDP going to Social Security between 2000 and 2023 is larger than the projected increase between 2023 and 2040, so this is clearly a manageable burden.
There is an issue that the Social Security trust fund is projected to face a shortfall starting in a bit more than a decade. This is a problem of allocation, not a direct drain of resources. The amount of resources needed to support the elderly population is determined by the number of elderly. We have been meeting this burden without major strains for well over a decade. Our economy can continue to do so, however, we have to decide how to allocate money to the Social Security program.
We can do that with designated taxes, as we have done since the program was created, or we can allocate money from general revenue. This is a political choice, but from an economic standpoint we clearly have the resources to pay benefits.
There is also a question of whether the benefits should be raised. The New York Times piece described incidents where elderly people were doing physically demanding jobs, presumably because they could not afford to retire. A modest increase in Social Security benefits (10-20 percent), for lower income retirees, would carry a relatively small price tag. This would make a large difference in the retirement prospects for lower paid workers, and mean that fewer would be forced to continue working late in life or when they are in bad health.
It would also help enormously if we could have serious discussions of tax increases, and not just for richest one percent. (We should definitely increase their taxes.) The Social Security tax was increased repeatedly over the five decades following its inception, from 2.0 percent in 1937 to 12.4 percent in 1990. It has not been increased at all in more than thirty years.
Part of the reason it was possible politically to increase taxes so much was that, at least through the first thirty-five years of the program’s existence, real wages were rising at a healthy pace. Taxing away a portion of the wage gains workers receive every year is an easier matter than asking workers to give up a portion of paychecks that are stagnant or even declining.
Fortunately, it appears that real wages are back on an upward path. Beginning in the middle of the last decade, real wages were rising at a rate of close to 1.0 percent annually for the typical worker. Pandemic inflation briefly stopped this growth, but it appears that real wages are again rising, especially for those in the bottom portion of the wage ladder. If this trend continues, modest increases in Social Security taxes should be a possibility, if that proves necessary.[1]
Getting Health Care Costs Under Control
A big part of the story of making the burden of an aging population manageable is getting our health care costs under control. The scare stories of the economy being crushed by a flood of retiring baby boomers were actually more a story of exploding health care costs than an increase in the ratio of retirees to workers. The proponents of the scare stories were simply being dishonest. Unfortunately, because of their standing in policy circles, their scare stories were taken seriously by the media.[2]
Fortunately, health care costs have not risen anywhere near as much as projected. In fact, in the last few years they have actually fallen slightly as a share of GDP. Nonetheless, we still pay more than twice as much per person as the average for other wealthy country countries. If we can get our health care costs closer to OECD average, it will make it far easier to care for a growing elderly population.
The basic story of our health care is that we pay far more for just about everything than people in other wealthy countries. The most glaring difference is with prescription drugs, where we often pay two or three times as much, for the same drug, as people in Europe and Canada.
The reason for this disparity is that we give drug companies patent monopolies, or related protections, and then, unlike any other country, tell the drug companies they can charge whatever they want. Every other wealthy country has some sort of price regulation that goes along with these government-granted monopolies.
We can get our prices down by adopting the same sort of restrictions on patent monopolies that Europe and Canada have. We will spend around $550 billion this year on prescription drugs. This is equal to 2.2 percent of GDP or more than 60 percent of the military budget. If we got our prices down to European levels we would pay around half of this amount. There is a similar story with medical equipment, although we only spend around $200 billion a year there.
Even better than reducing our payments for patent-protected drugs, we can stop relying on patent monopoly financing altogether for the development of new drugs. We can pay for the research upfront, as we did with the development of Moderna’s Covid vaccine. (We also allowed them to maintain a monopoly on the vaccine, in effect paying them twice.)
The government already spends over $50 billion a year on biomedical research through the National Institutes of Health. We could substantially increase the amount of public funding, but add the provision that all the drugs, vaccines, and other products developed must be fully open-source, so that they could be sold as cheap generics from the day they are approved.
We already have a great example of this model. Peter Hotez and Elena Bottazzi, two highly respected researchers at Baylor University and Texas Children’s Hospital, developed a simple to produce, 100 percent open-source Covid vaccine. It uses well-established technologies that are not complicated (unlike mRNA). Their vaccine has been widely used in India and Indonesia, with over 100 million people getting the vaccine to date.
Their vaccine sells for less than $2 a dose in India. If the FDA were to approve it here (it would likely cost around $10 million for the clinical trials needed to get approval) it would probably sell for less than $5 a shot. This compares to $110 to $130 dollars that Pfizer and Moderna want to charge for their boosters. If we got 100,000 people to take the Hotez-Bottazzi vaccine rather than the Pfizer-Moderna shot, it would cover the cost of the trials. If we got 1 million to take their vaccine it would cover the cost ten times over, and if ten million people took their vaccine it would cover the cost one hundred times over.
It is not just money we would save by going this open-source route. The huge markups that drug companies can charge due to patent monopolies give them an enormous incentive to lie about the safety and effectiveness of their drugs. We see this problem all the time, most notably with the opioid crisis where drug companies deceived doctors about the addictiveness of their drugs.
Another prominent example is the Alzheimer’s drug Adulhelm. Biogen, the manufacturer of the drug, was pushing the FDA for an accelerated approval, in spite of limited evidence of its effectiveness and serious harmful side effects. Their plan was thwarted after the resignation of several members of an FDA advisory committee. Biogen had planned to sell the drug for $56,000 for a year’s treatment. If Adulhelm was developed with open-source funding, and would be sold as a cheap generic upon approval, there would have been little incentive to try to get the FDA to ignore concerns about the drug’s safety and effectiveness.
Open-source drugs would also have a substantial impact on income inequality. The people who benefit from patent monopolies and related protections are almost all in the top 10 percent of the income distribution and many are in the top one percent. Forbes magazine calculated that the Moderna vaccine alone created five billionaires.
Aging Is a Distraction
We should recognize that the aging of the population will pose problems, but these problems are not qualitatively different, and almost certainly smaller in size, than the problems created by the baby boom cohorts when they were young. These problems are dwarfed by the problems created by inequality.
They are also aggravated by inequality. In a less unequal society, tens of millions of people would approach old age in better health. This is not only good for them, but it also means that paying for their health care would require fewer resources than if we continue on our current track.
Obviously, those who benefit from the extreme inequality we see at present would prefer that policy instead be focused on aging, as though this is a crisis. But their interests do not change the reality.
[1] Many economists, most notably former Treasury Secretary Larry Summers, have argued that the biggest problem facing an aging society is “secular stagnation.” This is a story where there is not enough demand to keep the economy operating at its potential and to keep workers fully employed. This is 180 degrees at odds with the story that we won’t have the resources needed to support a growing elderly population. If Summers’ secular stagnation view proves correct, then there would be no reason to have tax increases, since the economy is suffering from too little demand, not too much.
[2] The classic work in this vein was Peter Peterson’s mid-nineties gem, Will America Grow Up Before It Grows Old: How the Coming Social Security Crisis Threatens You, Your Family, and Your Country.
Read More Leer más Join the discussion Participa en la discusión
• Economic Crisis and RecoveryCrisis económica y recuperaciónHealth and Social ProgramsLos Programas Sociales y de SaludInequalityLa DesigualdadUnited StatesEE. UU.

In a lengthy piece on Republican proposals for cutting the food stamp program, the Washington Post found room to tell us that we spent $119 billion on food stamps last year, and it did not find any room to put this figure in a context that might make it meaningful to its readers.
Yeah, $119 billion is a lot of money, more than almost anyone other than Elon Musk (pre-Twitter) will ever see, but is it a big deal for the federal government? We can debate what is “big” or “small,” but the federal government spent $6,272 billion last year, which means that the food stamp program accounted for a bit less than 1.9 percent of total spending.
If the Republicans cut the program by 20 percent, a large cut, it would reduce federal spending by $24.8 billion, or a bit less than 0.4 percent. It would have been helpful to provide this context since it would make the point clear that Republicans will not get very far toward balancing the budget with cuts to the food stamp program.
It also would have been worth noting that research on the proposal for strengthening food stamp work requirements, a measure discussed at length in the piece, shows that these requirements have no impact on work. They do reduce the number of people getting benefits.
This research indicates that if the point of these requirements is to encourage work, they are not successful. However, if the point is to reduce the number of people benefitting from the program, the requirements will have this effect.
Read More Leer más Join the discussion Participa en la discusión
• Economic Crisis and RecoveryCrisis económica y recuperaciónPricesUnited StatesEE. UU.

On a lazy Friday afternoon, a person’s thoughts naturally turn to car price indexes. There is actually a reason that I became interested in this topic. I noticed that in the January Consumer Price Index, the new vehicle index rose 0.2 percent. The December measure was revised up due to new seasonal adjustment factors so that what had been reported as a 0.1 percent decline last month is now reported as a 0.6 percent increase.
I was inclined to think this was an aberration and that we would see the downward trend that had previously been apparent in the data reappear in another month or two. However, I noticed that the Manheim index for used vehicle prices showed a sharp uptick for January and the first half of February. This was after a full year in which declining prices were reversing much of the pandemic run-up. Perhaps my expectation that vehicle prices, both new and used, would soon look like they were back on their pre-pandemic path was wrong.
Vehicle prices are a big deal in the CPI. Together the new and used vehicle components comprise just under 7.0 percent of the overall index and 8.8 percent of the core index. As a result, it will have a big impact on our inflation measures if vehicle prices are on a downward path, as it seemed when we got the December CPI.
I thought I would look at a bit of history and pull in the index for imported vehicles. (This is not entirely apples to apples since the import index includes car parts.) Here’s the picture.
Source: Bureau of Labor Statistics.
As can be seen, the price index for imported vehicles somewhat outpaced the new vehicle index for the U.S. in the two decades prior to the pandemic. Currency values explain at least part of this movement. The dollar fell in value against the currencies of our trading partners from 2000 to 2012. It then began to rise modestly, which is the period when saw the gap close slightly. Still, by 2019 there was still a gap of roughly 7.0 percentage points, with the import price index rising by 9.8 percentage points since 2000, compared to an increase of just 2.8 percent in the new vehicle price index.
There was a larger gap between the new vehicle price index and the used vehicle price index. The used vehicle price index was actually 10.3 percent below its 2000 value in 2019, implying a gap of 13.1 percentage points between the new and used vehicle indexes over this 19-year period.
This story gets completely reversed in the years since the pandemic. Used vehicle prices are up by 37.2 percent, new vehicle prices are up by 20.1 percent, while the index for imported vehicles has increased by just 6.9 percent. This raises the question of whether there is some fundamental factor that has led to a lasting change in the pattern of new, used, and imported vehicles or whether this is a temporary story that will revert back to the pre-pandemic path in time.
Offhand, I can’t see any fundamental factor that has changed in a way that would affect these price trends. The dollar did rise in 2021 and earlier in 2022, which would lower imported car prices in the United States, but it is now pretty much back to its pre-pandemic level against most currencies, so currency valuations can’t explain much of the picture.
And, currency values won’t tell us anything about the far more rapid rise in used vehicle prices than new vehicle prices. This is easily explained in the context of pandemic shortages of cars, driving up used car prices, but if we envision a post-pandemic future where automakers can produce enough vehicles to meet demand, presumably, we will see the former pattern restored.
There may well be something that I am missing (suggestions welcome), but it still looks to me like we should expect the new vehicle index to converge towards the imported vehicle index and the used vehicle index to again drop below the new vehicle index. This path may take longer than I had expected, but it still seems likely.
That means that we should expect vehicle prices to be constraining inflation going forward. That may not be the case in the next couple of months, but it is likely to be true later in 2023 and into 2024.
Read More Leer más Join the discussion Participa en la discusión
• Affordable Care ActHealth and Social ProgramsLos Programas Sociales y de SaludSocial SecurityUnited StatesEE. UU.
A New York Times article on the economics and politics around Social Security and Medicare begins by telling readers:
President Biden scored an early political point this month in his fight with congressional Republicans over taxes, spending and raising the federal debt limit: He forced Republican leaders to profess, repeatedly, that they will not seek cuts to Social Security and Medicare.
In the process, Mr. Biden has effectively steered a debate about fiscal responsibility away from two cherished safety-net programs for seniors, just as those plans are poised for a decade of rapid spending growth.
It is not clear that “fiscal responsibility” has anything to do with this debate. First, it is not clear what that expression means. Would it have been fiscally responsible to have more deficit reduction in the years following the Great Recession, with the economy recovering slowly and unemployment remaining high?
In those circumstances, more deficit reduction would have meant slower growth and higher unemployment. Perhaps the New York Times would define deficit reduction that hurts the economy as being “fiscally responsible,” but it is not clear that most people would accept that definition.
The other part of the story is that Republicans have repeatedly demonstrated by their actions that they don’t care about budget deficits. Every time the Republicans have regained the White House in the last four decades, they have pushed through large tax cuts that resulted in large increases in the budget deficit.
Seeing this behavior, it is absurd to imagine that the leaders of the Republican Party are concerned about budget deficits (if this is how we are defining fiscal responsibility). They may claim to be concerned about budget deficits, but it would be irresponsible to imply that they actually are concerned about budget deficits.
In short, this is alleged to be a debate over “fiscal responsibility” or budget deficits. There is little reason to believe, at least on the Republican side, that this is actually a debate over budget deficits.
Spending on Social Security and Medicare Has Been Far Less Than Projected
It is also worth noting that the dynamics of the shortfalls facing Social Security and Medicare are somewhat different than implied by this piece. Social Security spending has already been rising rapidly, since most of the baby boom cohorts have already reached retirement age. Social Security spending rose from 4.19 percent of GDP in 2000 to 5.09 percent of GDP in 2023, an increase of 0.9 percentage points. It is projected to increase to 5.95 percent of GDP by 2040, a further rise of 0.84 percentage points.
This means that, in terms of its economic impact, we will not be seeing anything qualitatively different from what we had been seeing from Social Security. There is a different story going forward in that the dedicated trust fund built from the Social Security tax is projected to face a shortfall, but that is an issue of allocating governmental resources, not a question of requiring a more rapid diversion of resources to Social Security than we have been seeing for decades.
It is also worth noting that the cost increases for both Social Security and Medicare have been far less than had earlier been projected. The 2000 Social Security Trustees Report projected that Social Security spending would increase by 2.07 percentage points by 2025, to 6.26 percent of GDP. The 2022 Trustees report shows costs increasing by just 1.17 percentage points to 5.26 percent of GDP in 2025.
While there have not been explicit cuts to Social Security, changes in both practices and society have led to slower-than-projected cost growth. In the former category, a far higher rate of denial for disability claims has substantially reduced the cost of the disability program. In the latter category, the slower growth in life expectancy, especially for non-college-educated workers, has reduced the cost of the Social Security program. These are not necessarily positive developments, but they mean that Social Security is now costing far less than had been projected in the not-so-distant past.
There is a similar story with Medicare cost growth. Its spending was projected to rise by 0.61 percentage points to 2.0 percent of GDP in 2025. Its costs are now projected to rise to 1.68 percent of GDP in 2025, an increase of just 0.29 percentage points. This smaller increase is the result of a sharp slowing in healthcare cost growth after the passage of the Affordable Care Act in 2010. Here also, we have seen substantial savings against projected spending, even if there were no explicit cuts in the program.
Upward Redistribution Has Been a Major Factor in the Projected Social Security Shortfall
It is also worth noting that much of the projected shortfall in the Social Security program is due to the upward redistribution of income over the last four decades. In 1982, when the last major changes to Social Security were put into place, 90 percent of wage income fell below the cap on taxable wages (currently $160,200).
In the last two decades, just over 82 percent of wage income was subject to the Social Security tax (see page 148). There was also a redistribution from wage income to profit income, which further reduced Social Security tax revenue. Together, this upward redistribution accounts for more than 40 percent of the program’s projected shortfall over its 75-year planning horizon. If we had not shifted so much income to high-end earners and to profits, closing the projected shortfall in Social Security would be a far more manageable task.
Read More Leer más Join the discussion Participa en la discusión
There were several news stories on the 3.0 percent jump in retail sales the Commerce Department reported for January that took this as evidence that the economy was still very strong. In fact, since the January rise followed two months where reported sales fell sharply, the picture is far more ambiguous.
Reported sales fell by more than 1.0 percent in both November and December. As a result, reported sales in January were just 0.7 percent higher than those reported in October. Since these are nominal sales, it means that real retail sales have been close to flat over the last three months.
Likely, nominal sales did not really fall by more than 1.0 percent in November and December and then jumped by 3.0 percent in January. This is more likely an issue of seasonal adjustments for holiday shopping. Seasonal adjustments are always difficult, but post-pandemic shopping patterns make it harder for the Commerce Department to distinguish between sales changes reflected growth or weakness, as opposed to normal seasonal patterns.
In any case, when we get large changes like the 3.0 percent jump in sales reported in January, it is important to look back over the recent past to put them in context. No one looking at retail sales over the past three months can be concerned that they are growing too rapidly, even if the January jump, taken in isolation, might imply that.
Read More Leer más Join the discussion Participa en la discusión
According to news reports, Moderna is considering a price in the range of $110 to $130 for shots of its Covid booster. People may recall that we paid Moderna close to $450 million to develop its Covid vaccine. We then paid another $450 million for the clinical trials that were needed to determine its effectiveness.
Moderna has already made a good return on our tax dollars, selling the initial set of shots at around $20 a piece. According to Forbes, the company’s soaring stock price had already produced five billionaires by the summer of 2021.
Who knows how many Moderna billionaires we will have if the company gets away with charging $110-$130 for its new booster. Of course, this money will come out of the pockets of the rest of us, or at least those of us who are not prevented from getting boosters by these high prices.
Fortunately, there is an alternative if the Biden administration is prepared to challenge Moderna and drug companies more generally on their monopoly pricing. Peter Hotez and Elena Bottazzi, two highly respected researchers at Baylor University and Texas Children’s Hospital, developed a simple to produce, 100 percent open-source Covid vaccine. It uses well-established technologies that are not complicated (unlike mRNA). Their vaccine has been widely used in India and Indonesia, with over 100 million people getting the vaccine to date.
If we want to see the vaccine used here it would need to be approved by the Food and Drug Administration (FDA). In principle, the FDA could rely on the clinical trials used to gain approval in India, but it indicated that they want U.S. trials. (In fairness, India’s trials are probably lower quality.)[1]
However, the government could fund a trial of Hotez-Bottazzi vaccine (Corbevax) with pots of money left over from Operation Warp Speed, or alternatively from the budgets of National Institutes of Health or other agencies like Biomedical Advanced Research and Development Authority (BARDA). With tens of billions of dollars of government money going to support biomedical research each year, the ten million or so needed for a clinical trial of Corbevax would be a drop in the bucket.
The arithmetic on this is incredible. Shots of Corbevax cost less than $2 a piece in India. If it costs two and a half times as much in the U.S., that still puts it a $5 a shot. That implies savings of more than $100 a shot. That means that if we get 100,000 people to take the Corbevax booster, rather than the Modern-Pfizer ones (Pfizer is planning to also charge over $100 for its booster), we’ve covered the cost of the trials. If we get 1 million to take Corbevax, we’ve covered the cost ten times over, and if 10 million people get the Corbevax booster, we will have saved one hundred times the cost of the clinical trial.
There is also the advantage that, since at least some of the reason for vacine hesitancy is fears of mRNA vaccines. We may get some vaccine hesitant people to take Corbevax, who wouldn’t take the mRNA vaccines.
It is understandable that the pharmaceutical industry would be very unhappy if the Biden administration were to put up the money for a clinical trial of Corbevax. Not only would FDA approval seriously cut into the gold mine they were anticipating from selling boosters at more than $100 a shot, it would also be a dangerous example for the industry.
It would show that it is possible to develop effective vaccines without relying on government-granted patent monopolies. (Hotez and Bottazzi supported their research on small grants from the government and private foundations.) And, it would be a great reminder that vaccines (and drugs) are cheap. It is rare that it is actually expensive to manufacture and distribute a drug or vaccine. Drugs are expensive because we give companies patent monopolies, or other forms of protection.
If we pay for the research up front, we don’t have to gouge patients to recover development costs. And, we don’t give drug companies an enormous incentive to lie, cheat, and steal to maximize the value of their patent monopolies.
The Biden administration has a great opportunity to hugely advance public health, and set an incredibly important example, by putting up the money for a clinical trial of Corbevax. Bernie Sanders, as chair of the Senate Health Committee, can also get on the case. He has been critical of Moderna for charging outrageous prices for a vaccine developed with taxpayer money.
Sanders’ anger is quite justified. But rather than just haranguing the company into lowering its price, we can take away its ability to get away with charging $130 a shot by giving them some competition. Competition is great for capitalism, even if it may not be good for individual capitalists.
[1] It seems as though the pharmaceutical industry may also be working to slow the use of Corbevax outside of the United States. Hotez and Bottazzi have been unable to get the World Health Organization (WHO) to move on their request for pre-qualification, which they submitted back in June. They have been given no reason for the delay. This matters hugely for developing countries, because their health agencies are reluctant to approve a vaccine that the WHO has not pre-qualified.
Read More Leer más Join the discussion Participa en la discusión


