Article • Dean Baker’s Beat the Press
The Crushing Health Care Cost Burden that Never Came (Corrected)

Article • Dean Baker’s Beat the Press
Back in the 1990s we had ostensibly serious budget debates that were centered on avoiding a dark future where the deficits either soared to infinity or taxes took up all of our income. Private equity billionaire Peter Peterson provided much of the fuel for these debates. His money supported austerity promoting outfits like the Concord Coalition and the Committee for a Responsible Federal Budget. He also wrote several books that were deficit scare classics, like Will America Grow Up Before It Grows Old: How the Coming Social Security Crisis Threatens You, Your Family, and Your Country.
As some of us pointed out at the time, the heart of the austerity gang’s scare stories was not actually Social Security or the aging of the population, but rather projections of rapid growth in per person health care costs continuing for many decades into the future. This rapid growth was projected for both public and private sector costs.
If health care costs actually followed the projected growth path, it would devastate the economy, regardless of whether we paid for it through public programs like Medicare and Medicaid, or through private health care insurance and out-of-pocket spending. (Per person spending in public programs was actually rising less rapidly in the public sector programs than in the private sector.) The real issue had nothing to do with the government budget, it was fixing the health care system.
Anyhow, there actually is a good story here that has gotten far less attention than it deserves. Health care spending has not grown anywhere near as fast as had been projected. I previously did a piece showing that health care spending has actually fallen as a share of GDP since the pandemic. I decided to go back to 2000 and show the picture over the longer term.[1]
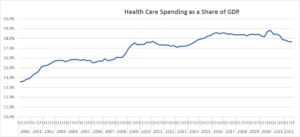
Source: Bureau of Economic Analysis and author’s calculations.
As can be seen, the share of GDP devoted to health care did rise sharply in the first three years of the century, rising from 13.6 percent at the start of the century to almost 16.0 percent by 2003. It then leveled off until the start of the Great Recession, when it jumped again, hitting 17.5 percent of GDP in 2009. It then leveled off again for several years, following the introduction of Obamacare, before edging up to 18.6 percent in 2016. Since then it was little changed, until it dipped sharply following the pandemic. In the most recent quarter it was just 17.6 percent of GDP, roughly the same share as we saw in 2009.
That was hugely better than was projected back in the Peter Peterson scare stories day. In fact, it was even hugely better than what the Congressional Budget Office (CBO) was predicting back in 2009. CBO’s long-term budget projections from 2009 showed that health care spending would be equal to 33.1 percent of total consumption spending by 2022 (Table F2-2). In fact, my calculations (adjusted for the 0.8 percentage point gap with CMS), show health care spending at just 24.8 percent of current consumption spending.
The gap between the 33.1 percent of consumption projection from CBO and 24.8 percent actual, is equal to more than $1.45 trillion on annual basis. This comes to $11,800 per family each year. Compared to projected path of growth of health care spending from 13 years ago, an average family has an additional $11,800 a year to spend on items other than health care.
This is a huge deal. After all the media have been telling us that families were devastated by inflation that outstripped wage growth by less than 1 percent since the start of the pandemic. Imagine how they would feel if they were paying another $11,800 a year for health care insurance or out-of-pocket spending.
We can debate why health care spending growth slowed so sharply. The Affordable Care Act almost certainly played an important role. The post-pandemic slowdown may reflect a switch to more telemedicine and at home diagnostic tests. (The use of therapeutic equipment has soared in recent years.)
This slower growth may reflect a deterioration in the quality of care. If so, we should see this in health outcome measures over time. We also should not be deceived in thinking that our health care system is now highly efficient. We still spend far more per person than every other wealthy country and more than twice as much as countries like Canada and France.
But, we have dodged the health care horror story that was projected in the 1990s by the Peter Peterson gang and more recently by CBO. And, that is very good news.
[1] These numbers are slightly higher than what the Centers for Medicare and Medicare Services (CMS) report for health care spending as a share of GDP. They showed a figure of 17.6 percent for 2019 (the last year for which data are available), while my calculations come to 18.4 percent. I assume this is due to some double counting, where I may have some government health care spending, which also shows up as consumption. For those wanting to check, I added lines 64, 119, 170, and 273 from NIPA Table 2.4.5U and line 32 from NIPA Table 3.12U. These are therapeutic equipment, pharmaceuticals and other medical products, health care services, and net health care insurance. Line 32 is the government spending on Medicaid and other health care provision. Although the level is somewhat higher than the CMS data indicate presumably the changes over this period follow the changes as measured by CMS reasonably closely.