


Read More Leer más Join the discussion Participa en la discusión
Read More Leer más Join the discussion Participa en la discusión
Read More Leer más Join the discussion Participa en la discusión
I’m a big fan of mass transit, bikes, and walking, but bad numbers are not the way to get people out of their cars. Someone came up with the statistic that the rate of traffic fatalties is 1.07 deaths per million vehicle miles traveled. Then, the NYT, ABC, NBC, Bloomberg, and AP all picked up this number.
Think about that one for a moment. The average car is driven roughly 10,000 miles a year. If you have 20 friends who are regular drivers, these news outlets want you to believe that one will be killed in a car accident every five years on average. Sound high?
Well, the correct number is 1.07 fatalities per 100 million miles according to the National Highway Traffic Safety Administration, so they were off by a factor of 100. So be careful driving this holiday weekend, but the risks are not quite as great as some folks are saying.
Thanks to Robert Salzberg for calling this one to my attention.
Read More Leer más Join the discussion Participa en la discusión
There is an ongoing myth about the downturn and the weak recovery that consumers unwillingness to spend has been a major factor holding back the recovery. An article in the Washington Post business section headlined, “heading into the holidays the retail industry faces a cautious consumer,” draws on this myth. The reality is that consumers have not been especially reluctant to spend in the downturn or the recovery as can be easily seen in this graph showing consumption as a share of GDP.
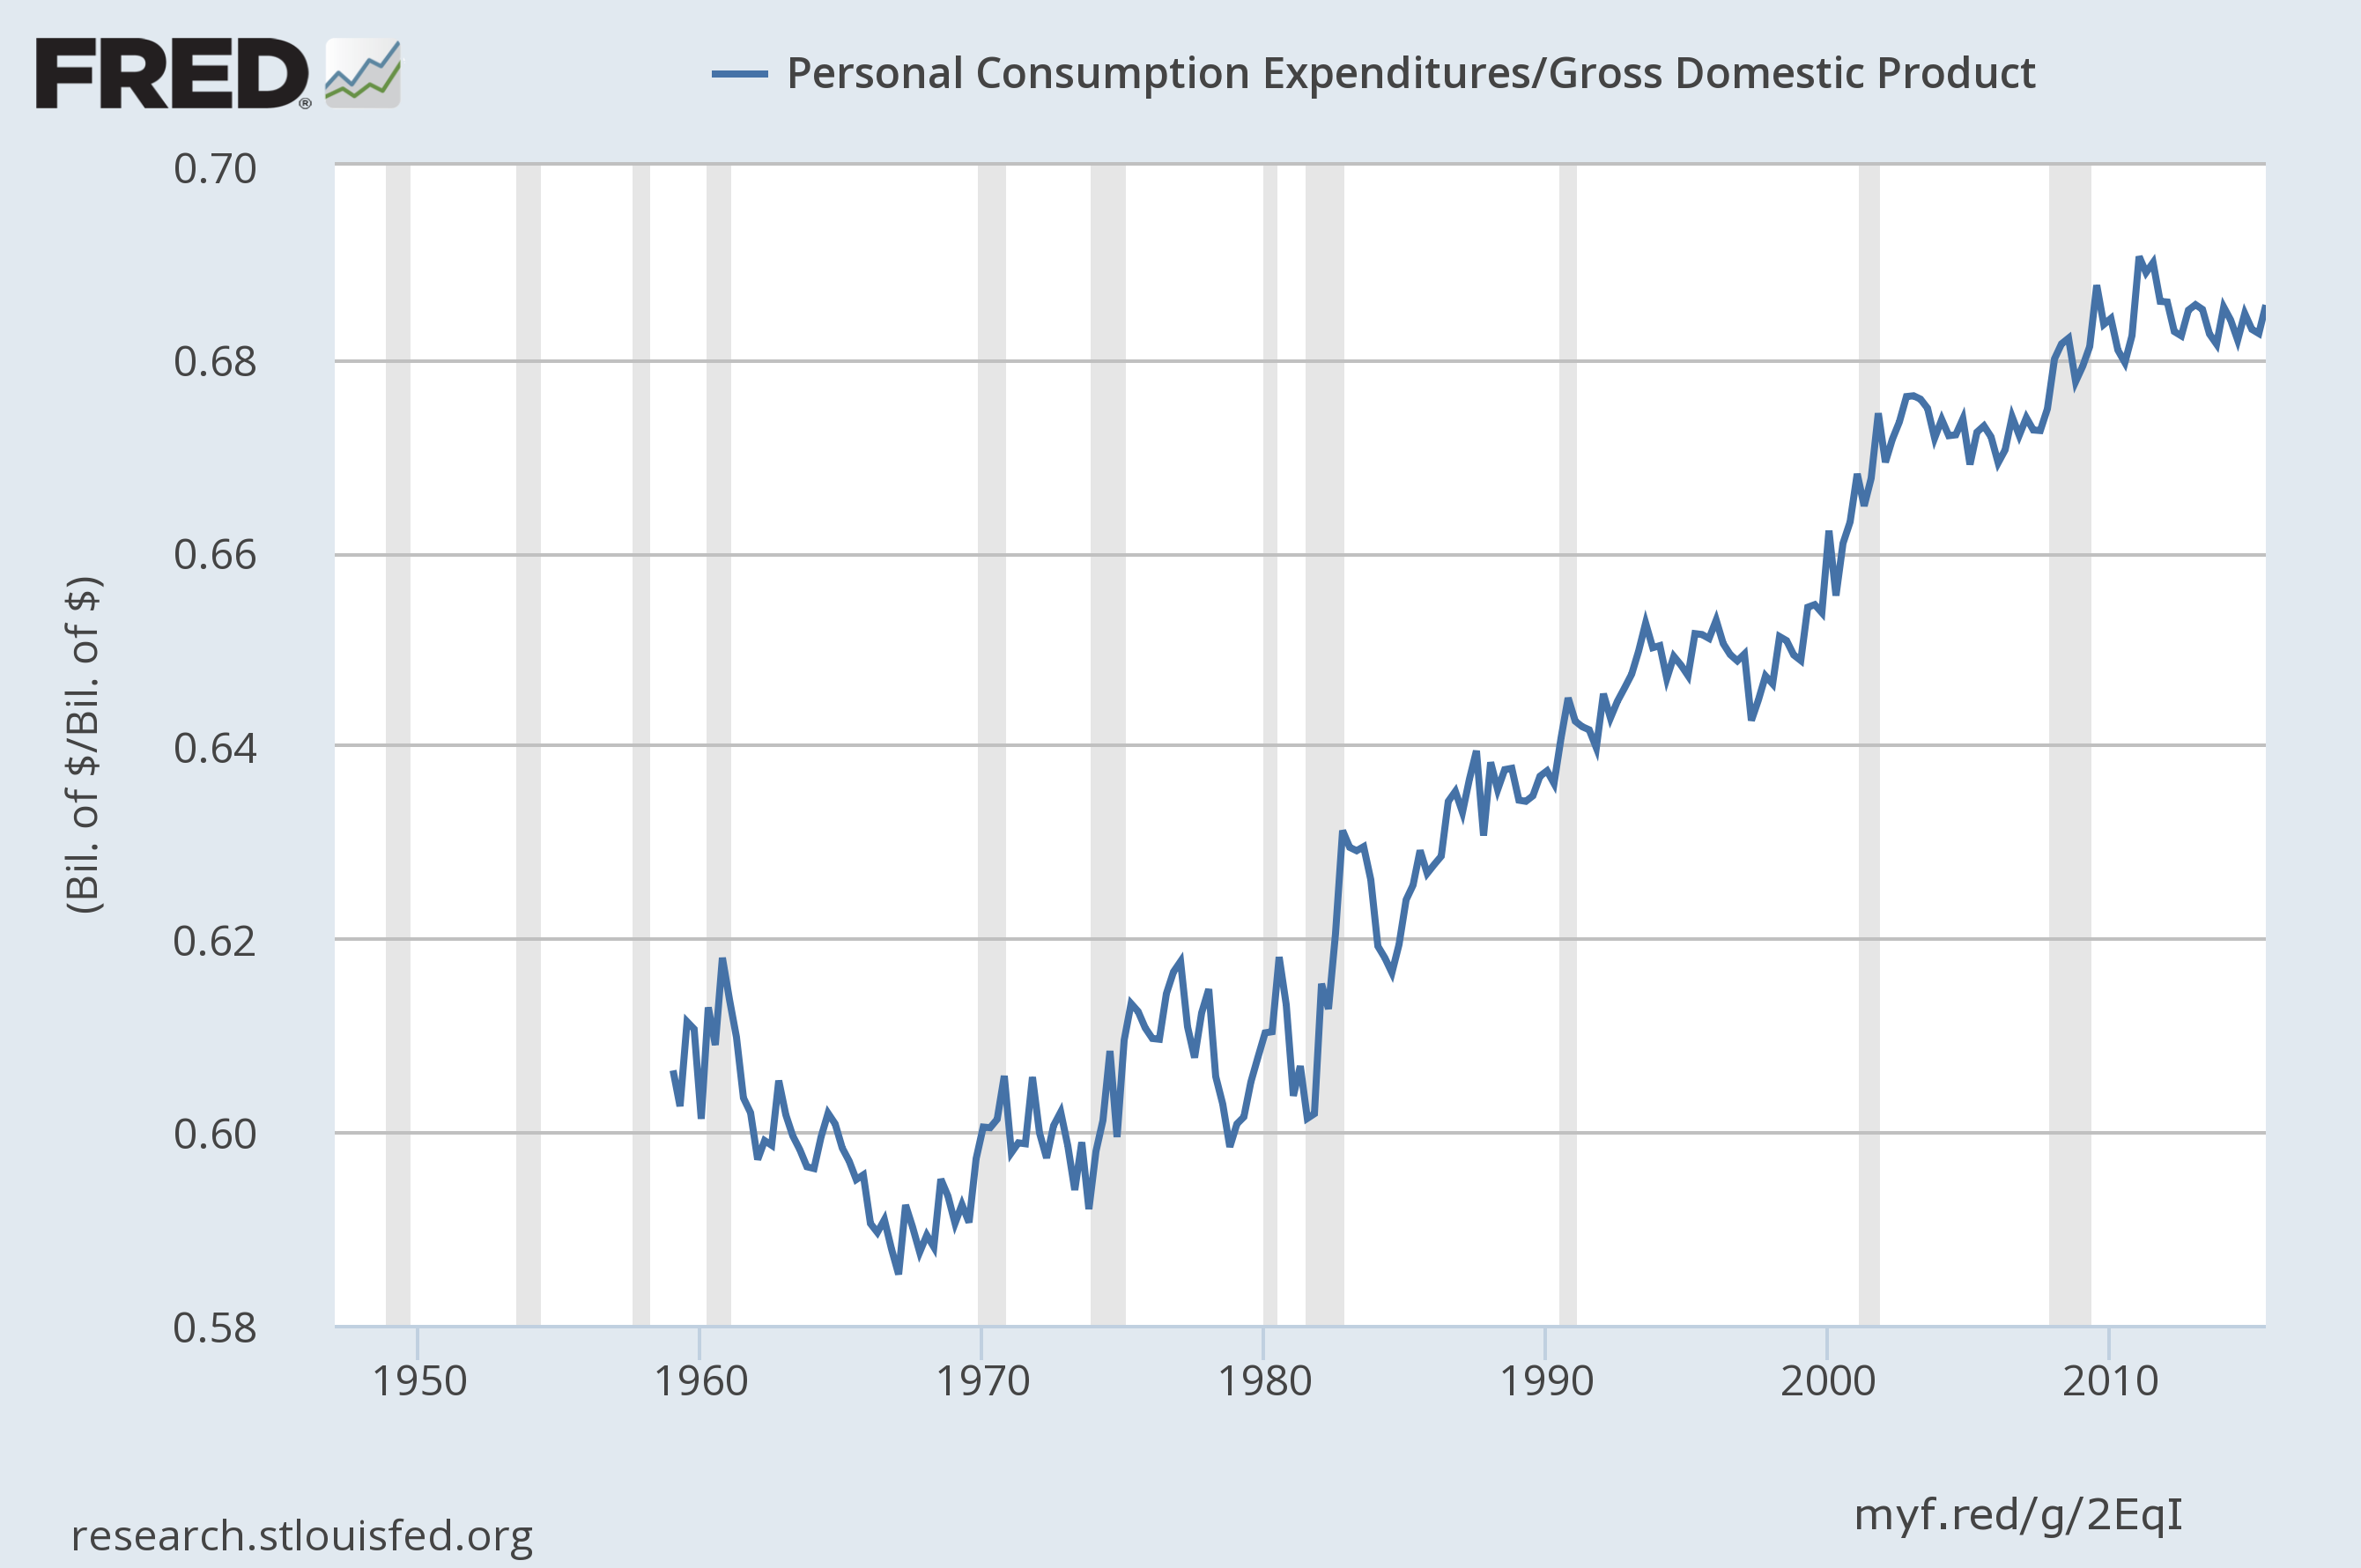
As can be seen, consumption is actually higher relative to GDP than it was before the downturn. It even higher relative to GDP than when the wealth created by the stock bubble lead to a boom in the late 1990s. The only time consumption was notably higher relative to GDP was in 2011 and 2012 when the payroll tax holiday on 2 percentage points of the Social Security tax temporarily boosted people’s disposable income relative to GDP.
(Those who see an upward trend need to think more carefully about what is being shown. Consumption can only continually rise as a share of GDP if investment and government spending continually fall and/or the trade deficit expands continually relative to the size of the economy. Standard models do not predict either event and both would be quite strange if true. It is also worth noting that the consumption share of GDP fell sharply in the 1960s due to the growth of investment and government spending.)
The weak consumption story is one of the myths that makes the housing bubble far more complicated that it actually is. The basic story is that housing construction, and the consumption driven by housing bubble generated equity, were driving the economy before the bubble burst in 2006–2008. When the bubble burst, the over-construction of the bubble years led to a huge falloff in construction and a temporary drop in consumption.
There was no component of demand that could easily fill this gap, which was on the order of six percentage points of GDP (@$1.1 trillion annually in today’s economy.) The stimulus went part of the way, but it was too small and faded back to near zero by 2011.
The problem of the continuing weakness of the economy is that we still have nothing to fill this demand gap. Housing has come back to near normal levels, but not the boom levels of the bubble years. If anything, consumption is unusually high, driven by house and stock prices that are above trend, even if not necessarily at bubble levels.
The one sure way to close the demand gap is to reduce the trade deficit, most obviously by getting down the value of the dollar. Unfortunately, the powers that be in Washington don’t talk about currency values, hence there are no provisions on currency in the Trans-Pacific Partnership. (There is an unenforceable side agreement.) We could try to get to full employment with shorter work weeks and years, through measures such as work sharing, paid family leave, and paid vacations, but this route is also largely off the agenda.
Anyhow, we don’t have cautious consumers and we don’t have any mysteries about the economy’s ongoing weakness. We just have a lot of confusion generated by the media in discussing the topic.
There is an ongoing myth about the downturn and the weak recovery that consumers unwillingness to spend has been a major factor holding back the recovery. An article in the Washington Post business section headlined, “heading into the holidays the retail industry faces a cautious consumer,” draws on this myth. The reality is that consumers have not been especially reluctant to spend in the downturn or the recovery as can be easily seen in this graph showing consumption as a share of GDP.
As can be seen, consumption is actually higher relative to GDP than it was before the downturn. It even higher relative to GDP than when the wealth created by the stock bubble lead to a boom in the late 1990s. The only time consumption was notably higher relative to GDP was in 2011 and 2012 when the payroll tax holiday on 2 percentage points of the Social Security tax temporarily boosted people’s disposable income relative to GDP.
(Those who see an upward trend need to think more carefully about what is being shown. Consumption can only continually rise as a share of GDP if investment and government spending continually fall and/or the trade deficit expands continually relative to the size of the economy. Standard models do not predict either event and both would be quite strange if true. It is also worth noting that the consumption share of GDP fell sharply in the 1960s due to the growth of investment and government spending.)
The weak consumption story is one of the myths that makes the housing bubble far more complicated that it actually is. The basic story is that housing construction, and the consumption driven by housing bubble generated equity, were driving the economy before the bubble burst in 2006–2008. When the bubble burst, the over-construction of the bubble years led to a huge falloff in construction and a temporary drop in consumption.
There was no component of demand that could easily fill this gap, which was on the order of six percentage points of GDP (@$1.1 trillion annually in today’s economy.) The stimulus went part of the way, but it was too small and faded back to near zero by 2011.
The problem of the continuing weakness of the economy is that we still have nothing to fill this demand gap. Housing has come back to near normal levels, but not the boom levels of the bubble years. If anything, consumption is unusually high, driven by house and stock prices that are above trend, even if not necessarily at bubble levels.
The one sure way to close the demand gap is to reduce the trade deficit, most obviously by getting down the value of the dollar. Unfortunately, the powers that be in Washington don’t talk about currency values, hence there are no provisions on currency in the Trans-Pacific Partnership. (There is an unenforceable side agreement.) We could try to get to full employment with shorter work weeks and years, through measures such as work sharing, paid family leave, and paid vacations, but this route is also largely off the agenda.
Anyhow, we don’t have cautious consumers and we don’t have any mysteries about the economy’s ongoing weakness. We just have a lot of confusion generated by the media in discussing the topic.
Read More Leer más Join the discussion Participa en la discusión
Read More Leer más Join the discussion Participa en la discusión
By Dean Baker and Evan Butcher
We all know how hard it is to get by in today’s competitive economy. That’s why billionaires need special help. The Wall Street folks got their multi-trillion bailout in the form of below market interest rate loans when their greed and incompetence would otherwise have put them into bankruptcy. The drug companies get longer and stronger patent monopolies both here, and with trade deals like the Trans-Pacific Partnership, around the world. And, Jeff Bezos and Amazon get tens of billions of dollars in handouts in the form of an exemption from collecting the same sales tax as his mom and pop competitors.
The basic story here is simple. States require that stores collect sales tax on the items they sell. This applies to every mom and pop book store or clothing store, as well as huge retailers like Walmart and Costco. Amazon, along with other Internet only retailers, has been able to escape this requirement in most states through most of its existence.
While Amazon was acting legally, this loophole in the law makes zero sense from an economic perspective, and even less from a moral perspective. From an economic perspective, it makes no sense for the government to effectively subsidize on-line businesses that operate out of state at the expense of businesses that operate and employ people in the state.
And, make no mistake; the exemption from the requirement to collect sales tax is a subsidy. The tax is directed at the customer, the retailer is performing a service for the government. Effectively, the exemption is allowing the retailer to profit by charging a price that is equal to the price a competitor charges plus the tax. For example, if a television sells for $400 in a state with a 5 percent sales tax, the Internet competitors can sell the same television for $420 and be charging no more than its brick and mortar competitors. They then put the extra $20 in their pockets.
This is the story of duty-free shops at airports. Generally the price on tobacco and liquor at these stores is comparable to prices in other stores. The difference is that the money the other stores pay to the government in taxes instead goes into the pockets of the owners of the duty-free stores.
This is the same story with Internet retailers. Amazon has effectively been subsidized by the amount of the sales tax that it would have been required to collect had it been subject to the same rules as its brick and mortar competitors. Instead of putting the extra profits into its pockets, it appears that Amazon has largely followed the strategy of passing on the savings to win market share at the expense of its competitors. This has proven to be an effective strategy, as its sales volume has made it the world’s most valuable retailer by market capitalization.
It is worth knowing how much taxpayers have given through the tax subsidy route to Jeff Bezos, now one of the world richest people. We calculated the amount that Amazon saved on sales tax through its existence. While many states no longer exempt Internet retailers from collecting taxes, 20 states still do. We added up the amount of tax that Amazon would have been required to collect in each state had it been subject to the same rules as it competitors for each year that it was able to avoid this requirement.[1] The total amount through 2014 comes to $20.4 billion. Bezos has gradually reduced his stake in the company over this period, but he still own close to 20 percent. If we apportion the subsidy accordingly, taxpayers have effectively handed $4.1 billion to Jeff Bezos over the last two decades.
In order to put this in perspective, the average monthly TANF payment to a family with one child is roughly $400. This means that taxpayers have given Jeff Bezos the equivalent of 10 million monthly TANF checks. The average food stamp payment is $127 per person per month. Jeff Bezo’s $4.1 billion in tax subsidies would amount to 31.5 million person months of food stamps.
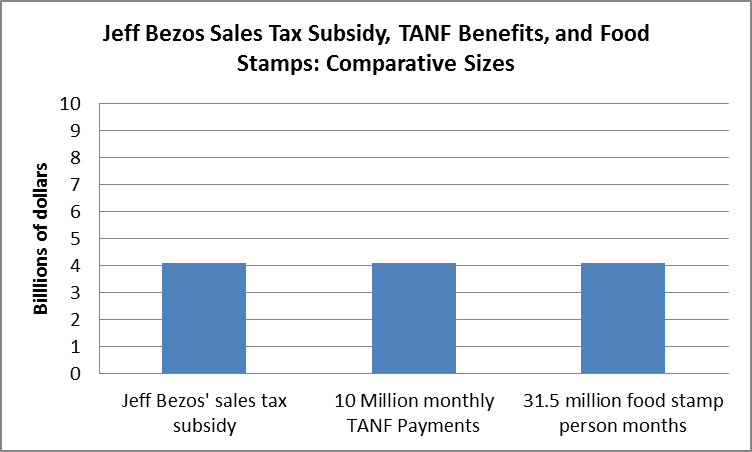
Source: authors’ calculations, see text.
So, as we prepare to celebrate this holiday season, we should keep in mind one person, Jeff Bezos, to whom the rest of us have been very generous.
[1] For simplicity, the calculation assumes that Amazon’s sales in each state were proportional to the state’s share in 2014 GDP. It applies a 5 percent real discount rate to past savings.
By Dean Baker and Evan Butcher
We all know how hard it is to get by in today’s competitive economy. That’s why billionaires need special help. The Wall Street folks got their multi-trillion bailout in the form of below market interest rate loans when their greed and incompetence would otherwise have put them into bankruptcy. The drug companies get longer and stronger patent monopolies both here, and with trade deals like the Trans-Pacific Partnership, around the world. And, Jeff Bezos and Amazon get tens of billions of dollars in handouts in the form of an exemption from collecting the same sales tax as his mom and pop competitors.
The basic story here is simple. States require that stores collect sales tax on the items they sell. This applies to every mom and pop book store or clothing store, as well as huge retailers like Walmart and Costco. Amazon, along with other Internet only retailers, has been able to escape this requirement in most states through most of its existence.
While Amazon was acting legally, this loophole in the law makes zero sense from an economic perspective, and even less from a moral perspective. From an economic perspective, it makes no sense for the government to effectively subsidize on-line businesses that operate out of state at the expense of businesses that operate and employ people in the state.
And, make no mistake; the exemption from the requirement to collect sales tax is a subsidy. The tax is directed at the customer, the retailer is performing a service for the government. Effectively, the exemption is allowing the retailer to profit by charging a price that is equal to the price a competitor charges plus the tax. For example, if a television sells for $400 in a state with a 5 percent sales tax, the Internet competitors can sell the same television for $420 and be charging no more than its brick and mortar competitors. They then put the extra $20 in their pockets.
This is the story of duty-free shops at airports. Generally the price on tobacco and liquor at these stores is comparable to prices in other stores. The difference is that the money the other stores pay to the government in taxes instead goes into the pockets of the owners of the duty-free stores.
This is the same story with Internet retailers. Amazon has effectively been subsidized by the amount of the sales tax that it would have been required to collect had it been subject to the same rules as its brick and mortar competitors. Instead of putting the extra profits into its pockets, it appears that Amazon has largely followed the strategy of passing on the savings to win market share at the expense of its competitors. This has proven to be an effective strategy, as its sales volume has made it the world’s most valuable retailer by market capitalization.
It is worth knowing how much taxpayers have given through the tax subsidy route to Jeff Bezos, now one of the world richest people. We calculated the amount that Amazon saved on sales tax through its existence. While many states no longer exempt Internet retailers from collecting taxes, 20 states still do. We added up the amount of tax that Amazon would have been required to collect in each state had it been subject to the same rules as it competitors for each year that it was able to avoid this requirement.[1] The total amount through 2014 comes to $20.4 billion. Bezos has gradually reduced his stake in the company over this period, but he still own close to 20 percent. If we apportion the subsidy accordingly, taxpayers have effectively handed $4.1 billion to Jeff Bezos over the last two decades.
In order to put this in perspective, the average monthly TANF payment to a family with one child is roughly $400. This means that taxpayers have given Jeff Bezos the equivalent of 10 million monthly TANF checks. The average food stamp payment is $127 per person per month. Jeff Bezo’s $4.1 billion in tax subsidies would amount to 31.5 million person months of food stamps.
Source: authors’ calculations, see text.
So, as we prepare to celebrate this holiday season, we should keep in mind one person, Jeff Bezos, to whom the rest of us have been very generous.
[1] For simplicity, the calculation assumes that Amazon’s sales in each state were proportional to the state’s share in 2014 GDP. It applies a 5 percent real discount rate to past savings.
Read More Leer más Join the discussion Participa en la discusión
Read More Leer más Join the discussion Participa en la discusión
Adam Davidson has an interesting piece in the NYT Magazine on the effectiveness, or lack thereof, of U.S. foreign aid. He discusses various models of aid, noting that none of them has been a clear success.
In commenting on the issue, the article says in passing that the United States spends $30 billlion a year to help the world’s poor. This figure could be misleading. Most readers are probably unaware of the size of the overall budget, therefore they may think that $30 billion involves a major committment of federal dollars. In fact, since we are spending $3.5 trillion a year in total, this sum comes to less than 0.9 percent of the total federal budget.
In discussing foreign aid, it is probably also worth mentioning the risk of corruption in the aid granting agencies. Foreign aid is a substantial source of money. For this reason it attracts not only people interesting in helping the world’s poor, it also attracts contractors looking to line their pockets. As a result, much of the spending may not end up being very helpful for its intended targets. This has likely been an especially serious problem in Haiti, which is the focus of the piece.
Note: Typos corrected, thank Joe E. and Robert Salzberg.
Read More Leer más Join the discussion Participa en la discusión
In today’s Washington Post, columnist Ruth Marcus contrasted the policies that Bernie Sanders advocates, which she characterizes as being about redistribution, with the policies advocated by the Wall Street funded policy group Third Way, which she describes as being about “expanding opportunity for participation.” While it is true that Third Way would like its policies to be described as being about expanding opportunity, it does not follow that this is true.
Third Way has promoted the macroeconomic, trade, and regulatory policies that gave us the Great Recession. While some of us were warning about the dangers of the housing bubble, Third Way was taking up space in the Washington Post and elsewhere warning about the dangers of retiring baby boomers. When the bubble burst, it left millions unemployed and tens of millions losing much or all of the equity in their homes. Low- and moderate-income families were especially hard hit. This did not expand opportunities for participation.
More generally Third Way has supported trade policies that have been designed to redistribute income upward and cost the country millions of good-paying middle income jobs. They also have refused to support measures that would address the ongoing trade deficit by adopting serious policies on currency management. It is understandable that Third Way would justify policies designed to redistribute income upward by saying they care about opportunity (“more money for Wall Street” is not a good political slogan), but that hardly makes the claim true.
On the other hand, policies advocated by Sanders, like a financial transactions tax and universal Medicare system, could provide a solid boost to growth by eliminating hundreds of billions of dollars of waste in the financial and health care sectors. These resources could be freed up to support productive investment, leading to an enormous boost to growth.
Read More Leer más Join the discussion Participa en la discusión


