


The NYT, along with most of the rest of the media, has been eager to highlight the costs and risks of a debt default and even the standoff over the debt. An article today pushed this line in part by misrepresenting the impact of the 2011 standoff. The piece quoted Beth Ann Bovino, chief United States economist at Standard & Poor’s:
“‘We saw huge effects during the summer of 2011, with consumer confidence hitting a 31-year low in August and third-quarter G.D.P. growing just 1.4 percent, … Given that this round of debt ceiling negotiations” took place during a shutdown, she said, “the impact on the economy could be even more severe.'”
The idea that third quarter GDP took a big hit from the standoff is more than a bit misleading. The sectors that might be expected to take a downturn from the uncertainty, consumption and investment, both did reasonably well. Consumption grew at a 2.1 percent annual rate in the quarter, up from a 1.8 percent rate in the first half of 2011. Fixed investment 14.8 percent annual rate in the quarter compared to a 4.1 percent growth rate in the first half of the year. Spending by the federal government and state and local governments did fall in the third quarter, but this was largely due to the end of the stimulus.
However the major drag on growth in the quarter was a slower pace of inventory accumulation. Inventories grew at a very rapid pace in the second quarter, adding 0.72 percentage points to growth for the quarter. The growth rate was considerably slower in the third quarter (this zigzag pattern in inventories is common). As a result, inventories subtracted 1.6 percentage points from GDP growth in the quarter. The 3.0 percent rate of final demand growth was the strongest of 2011.
Addendum:
This piece also mistakenly tells readers:
“Standard & Poor’s is more pessimistic, estimating that the shutdown will cut about 0.6 percent off inflation-adjusted gross domestic product, equivalent to $24 billion. Most analysts are predicting that growth will remain subpar, at an annual pace of 2 percent or less.”
The 0.6 percentage point drop is in the growth rate for the quarter, not GDP. (The drop in GDP would be roughly one fourth this amount, on an annualized basis.) Growth in the fourth quarter should increase by roughly the same amount as the third quarter falloff, although the loss in output in the third quarter will be permanent. Government workers cannot retroactively work the days they missed.
Thanks to Robert Salzberg for calling this to my attention.
Read More Leer más Join the discussion Participa en la discusión
The media seem to be on a crusade to scare readers into thinking that hitting the debt ceiling will be the end of the world. One item that has been useful in this process is the story that a technical default (a missed interest payment) in the spring of 1979 led to lasting rise in interest rates.
This story is apparently derived from an obscure 1989 article by Terry Zivney that claims this default led to a lasting 60 basis point increase in Treasury bill rates. NPR highlighted this study in the last debt crisis and it is apparently enjoying a resurgence of popularity in the current crisis.
There is nothing necessarily wrong with a study being obscure. That doesn’t mean it is wrong. After all, my warnings about the housing bubble from 2002-2007 were pretty damn obscure. However the fact that the study is obscure means that the economics profession does not accept its conclusion.
Interest rates are one of the most heavily studied topics in economics. None of the major analyses of trends in interest rates over the last four decades has the debt default in 1979 as a major explanatory variable. Thousands of economists have looked at the movement in interest rates over this period and none (other than Zivney) thought there was an unusual jump in interest rates in the spring of 1979 that need to be explained.
Here’s what the data look like:
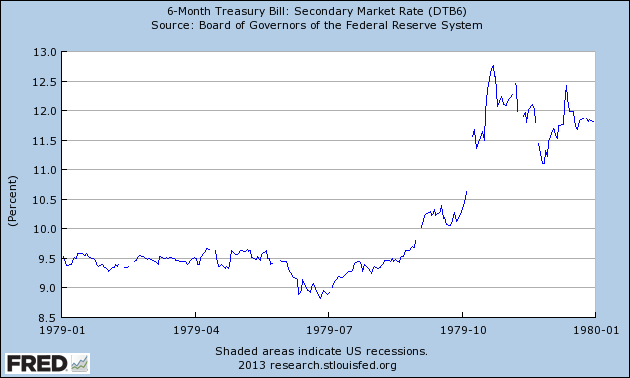
See the jump in late April and early May when the default took place? Yeah, I don’t either. Of course there is the possibility that interest rates otherwise would have fallen, but the default prevented this drop from occurring, but that seems like a big lift.
The moral of this story is that a debt default would be bad news for reasons that I and others have written about, but there is also a lot of silliness going around on the topic. We have a disastrous economy right now that is almost 9 million jobs below its trend level simply because we don’t have enough demand (e.g. government spending). That is really awful news. A debt default makes things worse, but I’m afraid that I can’t join the panic.
The media seem to be on a crusade to scare readers into thinking that hitting the debt ceiling will be the end of the world. One item that has been useful in this process is the story that a technical default (a missed interest payment) in the spring of 1979 led to lasting rise in interest rates.
This story is apparently derived from an obscure 1989 article by Terry Zivney that claims this default led to a lasting 60 basis point increase in Treasury bill rates. NPR highlighted this study in the last debt crisis and it is apparently enjoying a resurgence of popularity in the current crisis.
There is nothing necessarily wrong with a study being obscure. That doesn’t mean it is wrong. After all, my warnings about the housing bubble from 2002-2007 were pretty damn obscure. However the fact that the study is obscure means that the economics profession does not accept its conclusion.
Interest rates are one of the most heavily studied topics in economics. None of the major analyses of trends in interest rates over the last four decades has the debt default in 1979 as a major explanatory variable. Thousands of economists have looked at the movement in interest rates over this period and none (other than Zivney) thought there was an unusual jump in interest rates in the spring of 1979 that need to be explained.
Here’s what the data look like:
See the jump in late April and early May when the default took place? Yeah, I don’t either. Of course there is the possibility that interest rates otherwise would have fallen, but the default prevented this drop from occurring, but that seems like a big lift.
The moral of this story is that a debt default would be bad news for reasons that I and others have written about, but there is also a lot of silliness going around on the topic. We have a disastrous economy right now that is almost 9 million jobs below its trend level simply because we don’t have enough demand (e.g. government spending). That is really awful news. A debt default makes things worse, but I’m afraid that I can’t join the panic.
Read More Leer más Join the discussion Participa en la discusión
Many young people may have been misled by Thomas Friedman’s column, titled “Sorry Kids: We Ate It All,” which implied that our children might somehow suffer because we are paying so much to seniors for Social Security and Medicare. The reality of course is that if our children and grandchildren do not enjoy much higher standards of living than do current workers and retirees then it will be because the rich have rigged the deck so that they can accrue most of the gains from economic growth.
This is easy to show. For example, if we look at the Social Security trustees report we see that average annual wages are projected to grow at more than a 1.3 percent annual rate between now and 2050. As a result, the average before tax wage will be more than 60 percent higher in 2050 than it is today. If our children and grandchildren get to share equally in these gains then they will be far richer than we are today.
It’s true that we will have a higher ratio of retirees to workers in 2050, just as we have a higher ratio of retirees to workers than we did in 1970. Just as the increase in the ratio of retirees to workers over the last 4 decades did not prevent an increase in average living standards over this period, there is no reason to think it will prevent an increase in average living standards over the next four decades.
This is easy to show. Imagine that we saw an increase in the payroll taxes needed to supported to Social Security of 10 percentage points, far more than any plausible projections would imply is necessary. In this case, the average after-payroll tax wage would still be more than 40 percent higher than it is today. Should that make us apologize to our kids?
Of course these are averages. If we continue to see the pattern of the last three decades, in which the wealthy were able to secure for themselves most of the gains from growth, then our kids may not see a rise in living standards. But that would be a problem of upward redistribution, not an issue of the old benefiting at the expense of the young.
Furthermore, a large and growing cost of caring for our elderly is the cost of health care provided through Medicare and Medicaid. These costs are grossly out of line with costs in other wealthy countries. This is not due to our elderly getting better care, but rather due to the excessive payments made to doctors, drug companies, insurers, and medical supply companies. This is also a story of upward redistribution since the rich are the main beneficiaries of these excess payments.
If our health care costs were in line with costs elsewhere in the world we would be looking at huge budget surpluses and would have all sorts of money freed up for improving infrastructure, education, and research. (Of course this is a long-term story assuming we get back to something like full employment. At the moment the only thing keeping us from increasing spending in these areas is people with a bad understanding of economics.)
So kids, Thomas Friedman unfortunately may have misled you. There is no reason to worry about your parents or grandparents Social Security and Medicare putting you in poverty. The real problem is the money being redistributed from your parents, grandparents, and quite possibly you, to Wall Street traders, private equity barons, CEOs, drug companies, doctors, and others who are masters at gaming the system.
Read More Leer más Join the discussion Participa en la discusión
Since reporters always complain that they didn’t have enough space to include one or another item in their articles, why do they so often feel the need to add the word “free” to a reference to trade. That is exactly what the NYT did in an article on Italian Prime Minister Enrico Letta complaining about populism in Europe.
The reference to free-trade talks presumably meant the negotiations of a European Union-U.S. trade pact. Since formal trade barriers are already very low these negotiations are primarily over regulations. In many cases the goal is to limit the extent to which national and sub-national governments can impose safety and environmental regulations. In some cases, as with patents and enforcement of copyrights, the aim is to increase protectionist restrictions. For this reason it is highly inaccurate to describe the pact as a “free-trade” agreement.
Read More Leer más Join the discussion Participa en la discusión
The Washington Post had an article reporting on a commentary from a Chinese government owned news outlet that implied the country might move away from holding dollars. The article should have pointed out that such a move would be consistent with the publicly stated demand of both the Bush and Obama administrations that China stop “manipulating” its currency.
The way that China would “manipulate” its currency (keep its price down against the dollar) is by buying up huge amounts of dollars. If it sold dollars then its currency would rise against the dollar. That would make Chinese imports more expensive for people living in the United States, causing us to buy less of them. It would make U.S. exports cheaper for people living in China, leading them to buy more U.S. exports.
This change could go far toward reducing the U.S. trade deficit, especially if other developing countries follow China’s lead as they have in the past. The result would be millions of new jobs and also an important boost to wages. In other words, if China follows through on the path suggested in this article it would be good news for most of the country. Importers like Walmart and companies that have established production facilities in China, like General Electric, might be less pleased.
Read More Leer más Join the discussion Participa en la discusión
Read More Leer más Join the discussion Participa en la discusión
Today’s topic is how we are stuck in a slow growth path and therefore will have to take the ax to programs like Social Security and Medicare. Of course Samuelson always wants to take an ax to programs like Social Security and Medicare; this is just a new reason for cutting back programs that working people depend upon.
Most of his problem stems from the fact that he seems to have forgotten that we are still in a downturn, with the economy operating at a level of output that is more than $1 trillion below its potential according to the Congressional Budget Office. This means that when he complains about the impossibility of finding a political path to closing the structural deficit due to the growth of social spending (“welfare” to Samuelson), he is complaining about a problem that does not exist.
The most recent projections from the Congressional Budget Office show a baseline deficit projection for fiscal 2014 of around $600 billion. If the economy were operating at potential GDP, this would reduce this figure by around $300 billion. (An additional dollar of output will lead to roughly 30 cents in savings to the government due to higher tax collections and lower payments for programs like unemployment benefits and other transfers.)
This leaves a deficit of around $300 billion or roughly 1.8 percent of GDP. With a deficit of this size the debt-to-GDP ratio would be falling, which means that the government can run a deficit of this size in perpetuity.
It is true that in the longer term the deficit is projected to rise due to the rising cost of health care. The United States pays more than twice as much per person for its health care as other countries with nothing to show for this spending in terms of outcomes. Unfortunately, political debate in Washington is dominated by hard-core protectionists like Samuelson and the Washington Post editorial board who refuse to even consider plans to open up U.S. health care in ways that would reduce the income of doctors, drug companies, and insurers.
The high price of health care in the United States imposes an enormous burden on the economy and the budget. If the U.S. paid the same per person costs of health care as people in other countries we would be looking at enormous surpluses for the rest of the century, not deficits. Rather than reducing the extent to which the rich benefit from waste in the health care system, Samuelson and others want working people to get by with less care.
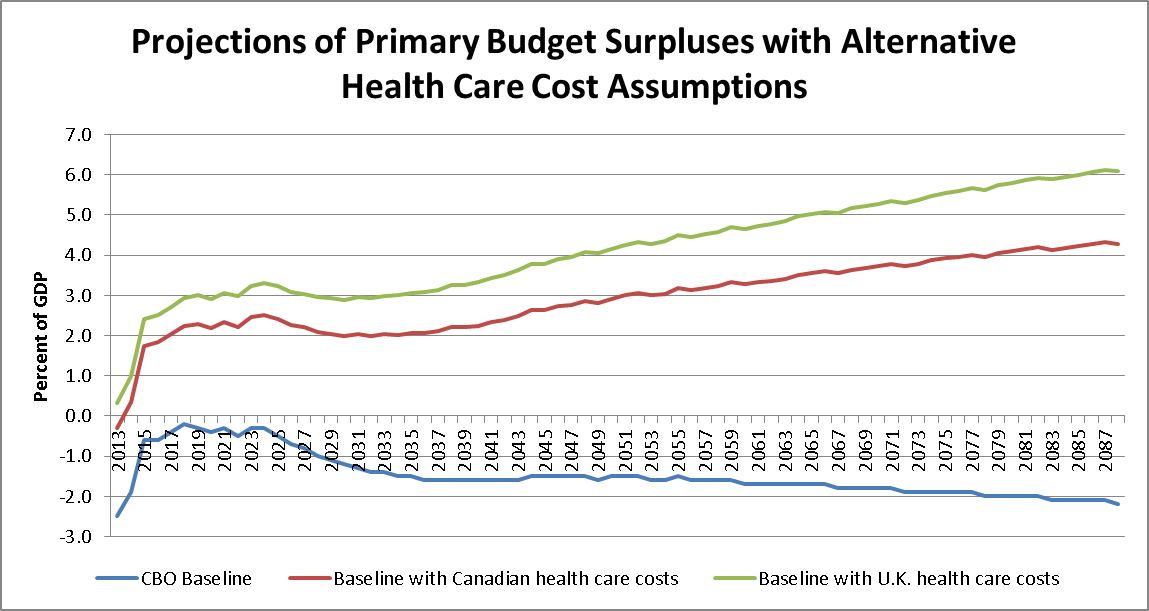
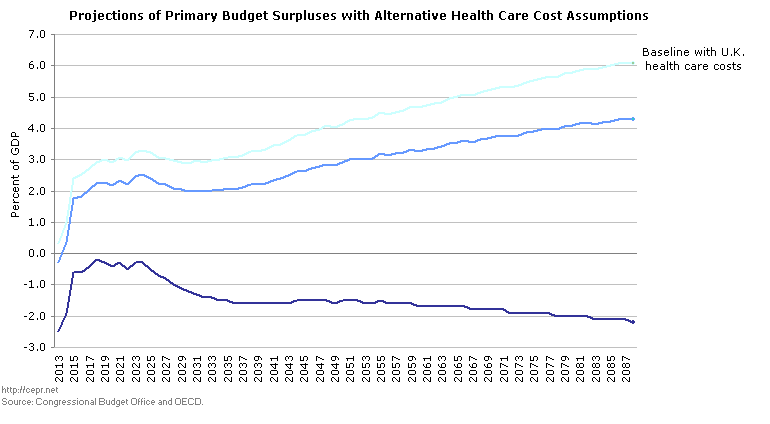
Source: CBO, OECD, and author’s calculations.
Samuelson is also wrong on other parts of his pessimism, most obviously he can’t seem to find his way over the Bureau of Labor Statistics website. He told readers:
“Take women’s labor-force participation. From 1950 to 2000, it surged from 30.9 percent to 59.9 percent; but in 2012, it was 57.7 percent, with the falloff starting before the recession.”
This is wrong. Our friends at the Bureau of Labor Statistics tell us that the labor force participation rate for women over age 20 went from 60.5 percent in 2006 to 60.6 percent in 2007. It dropped after the recession started at the end of 2007.
The basic story is that we are certainly seeing slow growth now, but this is because Congress is working hard to roll back sources of demand, most importantly government spending. For reasons that no one can explain we are not supposed to even talk about raising demand through reducing the value of the dollar and thereby increasing net exports.
As Keynes taught us almost 80 years ago, with weak demand the economy will grow slowly. We know how to fix this — spend money — but that is not in fashion right now. Instead, high unemployment and slow growth is the rage, but this is by design, not a fact of nature.
Today’s topic is how we are stuck in a slow growth path and therefore will have to take the ax to programs like Social Security and Medicare. Of course Samuelson always wants to take an ax to programs like Social Security and Medicare; this is just a new reason for cutting back programs that working people depend upon.
Most of his problem stems from the fact that he seems to have forgotten that we are still in a downturn, with the economy operating at a level of output that is more than $1 trillion below its potential according to the Congressional Budget Office. This means that when he complains about the impossibility of finding a political path to closing the structural deficit due to the growth of social spending (“welfare” to Samuelson), he is complaining about a problem that does not exist.
The most recent projections from the Congressional Budget Office show a baseline deficit projection for fiscal 2014 of around $600 billion. If the economy were operating at potential GDP, this would reduce this figure by around $300 billion. (An additional dollar of output will lead to roughly 30 cents in savings to the government due to higher tax collections and lower payments for programs like unemployment benefits and other transfers.)
This leaves a deficit of around $300 billion or roughly 1.8 percent of GDP. With a deficit of this size the debt-to-GDP ratio would be falling, which means that the government can run a deficit of this size in perpetuity.
It is true that in the longer term the deficit is projected to rise due to the rising cost of health care. The United States pays more than twice as much per person for its health care as other countries with nothing to show for this spending in terms of outcomes. Unfortunately, political debate in Washington is dominated by hard-core protectionists like Samuelson and the Washington Post editorial board who refuse to even consider plans to open up U.S. health care in ways that would reduce the income of doctors, drug companies, and insurers.
The high price of health care in the United States imposes an enormous burden on the economy and the budget. If the U.S. paid the same per person costs of health care as people in other countries we would be looking at enormous surpluses for the rest of the century, not deficits. Rather than reducing the extent to which the rich benefit from waste in the health care system, Samuelson and others want working people to get by with less care.
Source: CBO, OECD, and author’s calculations.
Samuelson is also wrong on other parts of his pessimism, most obviously he can’t seem to find his way over the Bureau of Labor Statistics website. He told readers:
“Take women’s labor-force participation. From 1950 to 2000, it surged from 30.9 percent to 59.9 percent; but in 2012, it was 57.7 percent, with the falloff starting before the recession.”
This is wrong. Our friends at the Bureau of Labor Statistics tell us that the labor force participation rate for women over age 20 went from 60.5 percent in 2006 to 60.6 percent in 2007. It dropped after the recession started at the end of 2007.
The basic story is that we are certainly seeing slow growth now, but this is because Congress is working hard to roll back sources of demand, most importantly government spending. For reasons that no one can explain we are not supposed to even talk about raising demand through reducing the value of the dollar and thereby increasing net exports.
As Keynes taught us almost 80 years ago, with weak demand the economy will grow slowly. We know how to fix this — spend money — but that is not in fashion right now. Instead, high unemployment and slow growth is the rage, but this is by design, not a fact of nature.
Read More Leer más Join the discussion Participa en la discusión
That’s what the NYT told readers at the very beginning of its piece on negotiations over the reopening the government and the debt ceiling. Okay, that line probably was not intended to refer to the NYT’s budget reporting, but it certainly is appropriate in that context.
This stuff is getting to be a really bad joke. At one point this piece tells readers:
“That suggests a less ambitious outcome for any deficit-reduction talks that would spring from the current impasse. In the past, the general goal was $4 trillion in savings in 10 years that would compound over time.”
Less ambitious, really? The $4 trillion referred to in that “grand bargain” scheme was compared to a 2010 baseline that assumed far larger deficits. Over the 10 year horizon from 2014-2023 that baseline would have shown deficits of more $9 trillion (see the “plausible baseline” in figure 14 ). Due to the sharp spending cuts and tax increases that have been put in place in the last two years, the current baseline shows a cumulative deficit over this period of 6.3 trillion. This means that the amount of deficit reduction discussed in this piece is very much in line with, and quite possibly larger than the “grand bargain” for which the NYT apparently lusts.
The reality is that the sharp deficit reduction we have seen in the last three years has thrown millions of people out work and cost the country more than $1 trillion in lost output. It is bizarre that this fact is rarely noted in the NYT’s budget reporting and it instead tries to imply that there is some urgency about addressing deficits projected for the distant future that may not even materialize.
Read More Leer más Join the discussion Participa en la discusión
The Wall Street Journal continues to lead the path in the post-truth world, with columnist Andrew Puzder misrepresenting numbers to show that ObamaCare has led to a “part-time economy.” Pudzer’s whole story rests on the growth in part-time employment from January to July as measured by the Bureau of Labor Statistics household survey. He tells readers:
“The health-care law’s actual consequences unequivocally appear in the jobs data for this period. Between Jan. 1 and June 30, according to the Bureau of Labor Statistics, the economy added 833,000 part-time jobs and lost 97,000 full-time jobs, for net creation of 736,000 jobs. In reality, the economy overall added no full-time jobs. Rather, it lost them.”
Later adding:
“In August, Keith Hall, who ran the Bureau of Labor Statistics from 2008-12, looked at part-time hiring from the end of January through July and told a McClatchy reporter that the results were ‘really remarkable’ and ‘a really high number for a six-month period. I’m not sure that has ever happened over six months before.””
Wow, Keith Hall can’t remember a six-month period where part-time jobs rose by 833,000? How about the six months from June of 2008 to December of 2008 when part-time employment rose by 1,963,000, while full time employment fell by 4,453,000? Is he really not able to remember back five years ago to a period in which he was actually the commissioner of the Bureau of Labor Statistics? Perhaps he didn’t count this one because all of that rise in part-time employment was involuntary whereas most of the reported increase in January to July of this year was voluntary.
How about April of 2001 to October of 2001 when part-time employment rose by 1,115,000 (again, all involuntary), while full-time employment fell by 2,053,000? Again, this was all due to a rise in people working part-time involuntarily — they wanted full-time jobs — so maybe Hall doesn’t count this period either.
In fact these data are highly erratic. They jump around by large amounts month to month due to measurement error, not reasons having anything to do with the economy. For this reason, picking January of 2013 as a starting point is a bit of a joke.
Reported part-time employment fell sharply in the second half of 2012 (because of the ACA?), dropping from 26,623,000 in July of 2012 to 26,049,000 in January of 2013. This drop in the reported number of part-time workers almost certainly did not reflect what was going on in the economy, but was rather just random errors that show up in the data from month to month.
A serious analysis would look at an average level of employment over a series of months, for example comparing the first six months of 2013 (when the employers thought the sanctions would be in effect) with the first six months of 2012. My colleague Helene Jorgenson and I did this analysis. We found a small decline in the percentage of workers who were working less than the 30 hour cut-off that makes employers subject to the mandate. I wouldn’t attribute the increase in full-time employment to Obamacare, but at least this claim would have some basis in the data, unlike the complaints in Pudzer’s column.
Btw, there is one last point that should be raised. What’s wrong with people working part-time? We should be concerned if people want full-time jobs but can only find part-time work. This likely means that they will be struggling to support themselves and their families.
But what is wrong with someone voluntarily choosing to work part-time? Many people opt for part-time employment to be with their family, enjoy a partial retirement, or pursue other activities. Does the WSJ think it has to decide for us how many hours we should work?
Read More Leer más Join the discussion Participa en la discusión
Glenn Kessler has a useful column assessing Senator Rand Paul’s claims about how default could be avoided if we reached the debt ceiling, however he does get one important item wrong. The piece implies that it would be possible to save money to pay debt service or other top priority items by not making Social Security payments.
This is not true. The money held by the Social Security trust fund is part of the debt subject to debt ceiling. If money is not paid out to Social Security beneficiaries then there is more money in the Social Security trust fund.
This is a dollar for dollar relationship. This means that every dollar that the government does not have to borrow on public markets to make Social Security payments is an additional dollar owed to the Social Security trust fund, leaving no net change in the amount of borrowings subject to the debt ceiling. This means that the payment of Social Security benefits does not affect whether or not the government breaches the debt ceiling.
There is one other item in this piece that deserves comment. It reports an assessment from the Government Accountability Office that higher interest rates from the August 2011 standoff will lead to $19 billion more in interest payments over a ten-year period. It is unlikely that many Post readers have the ability to assess the importance of $19 billion in the federal budget over a 10-year period. If we turn to the Center for Economic and Policy Research’s magnificent responsible budget calculator we see that this would be roughly 0.045 percent of projected spending over the period from 2012-2021.
Addendum: Kessler added a note making this point.
Read More Leer más Join the discussion Participa en la discusión


