Article
How Restricting Reproductive Rights Hurts People with Disabilities: A Review of Research Findings

Article
After the recent Supreme Court decision in Dobbs v. Jackson Women’s Health Organization, women around the country are reminded daily of their status as second-class citizens. In many states, abortion policies are already restrictive, and a handful have completely banned the practice. In other states, the jury is still out on the legality of various restrictions. Upcoming midterm elections will also play a role in determining where state abortion policies land. Recently, Kansas voters decisively struck down an amendment to the state constitution that would have paved the way for an abortion ban.
On July 26th, amidst the backlash to Dobbs, the US celebrated the 32nd anniversary of the Americans with Disabilities Act. A week later, the Department of Justice sued Idaho to protect the reproductive rights of women who have the right to emergency treatment, including abortion as a necessary stabilizing treatment for an emergency medical condition, under federal law. The ADA anniversary and the DOJ lawsuit are reminders that people with disabilities who can become pregnant are among those most negatively impacted by state abortion bans and restrictions.
This article documents the prevalence of disability among women of reproductive age by state, disability status, type of disability, and income. It then chronicles findings from scholarly research that suggest women and people with disabilities who can become pregnant are at risk of greater harm if denied access to safe abortion services. Restricting access to those services could have dire consequences for disabled people for several reasons.
First, people with disabilities already experienced increased difficulty accessing adequate reproductive health services before Dobbs. Second, health risks associated with pregnancy can be more severe for people with disabilities. Lastly, people with disabilities are more likely to experience unintended pregnancy and uncertainty about becoming pregnant.
While this piece focuses on academic research, we should not lose sight of the fact that, as Kendall Ciesmier writes, “What chronically ill and disabled people need is autonomy to make the health care choices right for them. It’s what we all deserve.”
Of the nearly 74 million women of reproductive age (15–49) in the US, about 7 percent (5.2 million) have one or more disabilities. Just over half of disabled women of reproductive age (53 percent) live in the 26 states that have banned or are likely to ban abortion (see Table 1). In addition, about 55 percent of all disabled women of reproductive age in the US have very low or low incomes (below 200 percent of the official poverty line, or $26,600 in pre-tax income for a single adult living alone in 2019). The same is true in the 26 abortion-ban states.
| United States | States Likely to Ban | States Not Likely to Ban | |||
|---|---|---|---|---|---|
| Number | Percent | Number | Percent | ||
| All Income Levels | 74,341,946 | 35,717,936 | 48.1% | 38,624,010 | 52.0% |
| Have One Type of Disability | 2,959,040 | 1,556,822 | 52.6% | 1,402,218 | 47.4% |
| Have Two or More Types of Disability | 2,236,135 | 1,189,969 | 53.2% | 1,046,166 | 46.8% |
| Low Income | 26,311,858 | 13,783,745 | 52.4% | 12,528,113 | 47.6% |
| Have One Type of Disability | 1,537,078 | 852,561 | 55.5% | 684,517 | 44.5% |
| Have Two or More Types of Disability | 1,333,498 | 733,446 | 55.0% | 600,052 | 45.0% |
Source: Author’s analysis of 2015–2019 American Community Survey 5-Year Estimates downloaded from IPUMS USA, University of Minnesota, www.ipums.org.
Note: Estimates of the prevalence of disability vary by the survey used and the disability questions asked. The American Community Survey likely provides a conservative estimate of disability prevalence but is used in this article because it has a large sample size that allows for reliable state-level estimates in all 50 states. A person is classified as having very low or low income if their pre-tax family income is below 200 percent of the official poverty line. The official poverty measure (OPM) is outmoded in many respects, but using 200 percent of the OPM line reasonably captures people who are economically insecure.
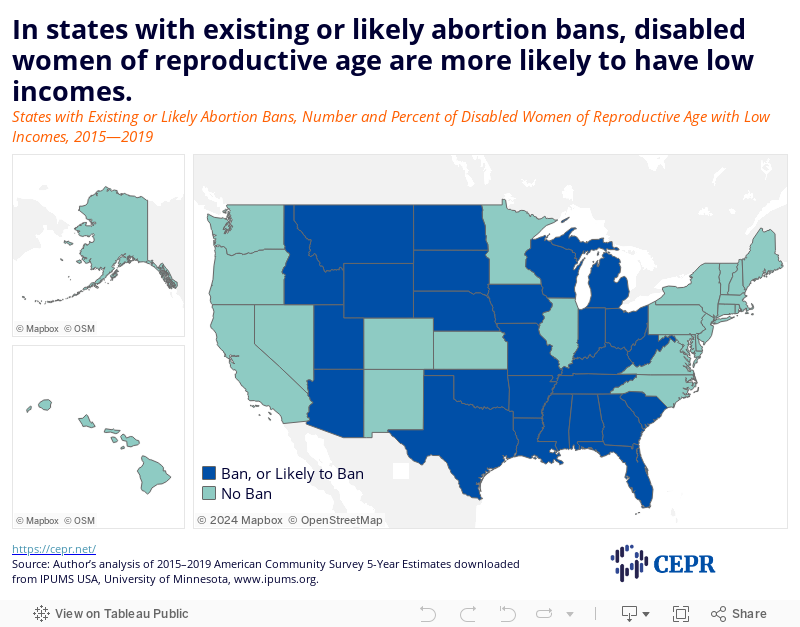
Economic insecurity is highest in West Virginia (68 percent), Mississippi (65 percent), and Kentucky (65 percent), but in almost every one of these 26 states (except Utah) a majority of women with disabilities of reproductive age live below 200 percent of the poverty line (see Figure 1). Texas, Florida, and Ohio are the three abortion-ban states with the highest number of disabled women of reproductive age. In these states, 53 percent, 54 percent, and 61 percent of disabled women of reproductive age, respectively, have very low or low incomes. Notably, these shares are lowest in Maryland, New Jersey, and Hawaii, where abortion bans are not being considered.
Figure 1
Access to reproductive health care was more severely restricted for people with disabilities even before the Supreme Court reversed its Roe v. Wade ruling. For example, disabled women may be denied care by clinics due to their disabilities. Interviews conducted by Mitra and others in “Pregnancy among women with physical disabilities: Unmet needs and recommendations on navigating pregnancy” reveal that clinicians’ limited understanding of disabilities and their potential impacts on pregnancy is a major concern for disabled pregnant people. One mother in their study said, “You have to advocate, you have to do your homework, you have to know…what you need so that you can explain it to them [clinicians] and know when they’re off base.” Another study by Mitra and others, “Access to and Satisfaction with Prenatal Care Among Pregnant Women with Physical Disabilities: Findings from a National Survey,” found that 40.3 percent of women with disabilities surveyed thought their prenatal care provider knew little to nothing about how their disability would affect their pregnancy.
Clinics themselves also pose barriers to reproductive care for people with disabilities. For example, facilities may have narrow doorways or use equipment that require patients to stand (e.g., scales, mammography machines). In “Experiences of Women With Disabilities in Accessing and Receiving Contraceptive Care,” Horner-Johnson and others find that patients with physical disabilities often struggle to mount examination tables when lifts are not provided, while people with sensory disabilities have difficulty with paperwork and obtaining American Sign Language interpreters. Mitra and others also found that physical accessibility ranked highly among disabled women’s top unmet needs during pregnancy. Some with physical disabilities reported that their spouses were expected to transfer them to the examination table. Others described the arduous process of being weighed on scales that required the patient to stand.
Reproductive health information and education is also often inaccessible to people with disabilities. “Health knowledge and the impact of social exclusion on young people with intellectual disabilities,” by Pownall and others, found that a group of young people with mild intellectual disabilities and another with physical disabilities had more limited understanding of personal health issues like pregnancy and contraception than their peers without disabilities. McCabe reinforces these findings. When asked about 11 different topics related to sex and sexuality, people with intellectual and physical disabilities demonstrated less knowledge across the board. In addition, while the general population was more likely to report learning about sexuality through friends and family, disabled respondents’ primary source of sex education was through media and formal classes where asking questions might not be possible or comfortable. A study of deaf and hearing college students found that hearing students were significantly more knowledgeable about sexuality (although neither group was highly informed). Many studies suggest that societal views that characterize disabled people as asexual or incapable of sexual activity may contribute to this dearth of reproductive health education.
The potential health risks associated with pregnancy can be greater for people with disabilities. A meta-analysis, conducted by Tarasoff and others, to examine the relationship between maternal disability and pregnancy complications found that women with disabilities had an increased risk of hypertensive disorders and cesarean delivery. In “The Intersection of Disability and Pregnancy: Risks for Maternal Morbidity and Mortality,” Signore and others review evidence of specific health conditions arising for women with disabilities, such as infection, hemorrhage, cardiomyopathy, thromboembolic disease, and other cardiovascular diseases. They note, however, that more studies are needed on associations between specific disabilities and health conditions before, during, and after pregnancy.
A study by Clements and others, used hospital records to identify associations between disability risk (i.e., risk of developing a disability due to a preexisting health condition) and maternal and infant outcomes. They found that women with disability risk were more likely to have pregnancy risks and adverse infant and maternal outcomes relative to those who did not show disability risk. For example, women at risk for disability were almost twice as likely to have a preterm birth and more than three times as likely to experience extended hospitalization. Another study found similar results for women with intellectual and developmental disabilities, who were more likely to have a preterm birth, low birth weight, and stillbirth.
Notably, pregnancy may also worsen existing disabilities or cause new ones to arise. Italian researchers found that women with multiple sclerosis who experienced a relapse in the year leading up to conception were more likely to see their disability worsen in the longer term. A study in Norway found that positive posterior pelvic pain provocation test results early in pregnancy were associated with disability in later stages. Others have documented that lupus, thrombophilia, migraines, heart disease, sickle cell disease, hypertension, and thrombocytopenia are strongly associated with pregnancy-related stroke resulting in disability.
Unintended pregnancy is a common reason for seeking an abortion. Several studies report that people with disabilities may be more likely to experience unintended pregnancy than those without disabilities. Research, conducted by Horner-Johnson and others, found that over half (53 percent) of disabled women described their pregnancies as unintended, compared to just over a third (36 percent) of women without disabilities. Among the different types of disabilities identified by the researchers, those with independent living, hearing, and cognitive disabilities were most likely to report unintended pregnancy. It is important to note that viewing pregnancy decision-making as binary—that is, as either intended or unintended—may fail to capture the nuance and complexity involved in the pregnancy planning process. Gomez and others propose acceptability as a useful alternative.
A study by Shandra and others found that women with disabilities who did not yet have children were more likely to express uncertainty about their intentions to have children when compared to nondisabled women. They were also more likely to want additional children but not plan on having them. Another study by Wu and others explored unplanned pregnancy and contraceptive use among reproductive-age women with physical and sensory disabilities. The authors found that 27 percent of women with disabilities at risk of unplanned pregnancy did not use contraceptives. Disability was also associated with reduced use of highly and moderately effective contraceptives versus less effective ones.
People with disabilities may also be more likely to experience intimate partner violence, in some cases leading to unintended pregnancy. A study by Barrett and others found that women with disabilities were over 10 percentage points more likely to experience intimate partner violence than women without disabilities. Another study by Casteel and others found that women with disabilities that severely limited daily activities were four times as likely to experience sexual assault, compared to women without disabilities. The Bureau of Justice Statistics has reported that disabled individuals are over three times more likely than those without disabilities to experience rape or sexual assault, among other types of serious violent crime.
People with disabilities likely face a greater financial burden during pregnancy. Research by Peterson and others have shown that expecting parents are more likely than other reproductive-age adults to experience catastrophic health expenditures. Parents with low incomes were even more affected and often relied on public insurance to ease the financial strain.
Pregnancy-related expenses could be crushing for the nearly one-fourth of people with disabilities living below the poverty line. Many must already contend with a higher cost of living, magnified by out-of-pocket expenses that health insurance will not cover, such as home modifications and personal care assistants. A study by Goodman and others estimated that households containing one disabled adult need 28 percent more income on average than households with no disabled members to achieve the same standard of living.
Inadequate reproductive care, heightened health risks, and increased likelihood of unintended pregnancy make access to safe, legal abortion vital for people with disabilities. While even states with total bans allow exceptions when the life of the person giving birth is at risk, the same cannot be said for threats to physical health. In theory, these exceptions should make abortion procedures widely available. In practice, they may do little to protect women who experience life-threatening pregnancy complications and create confusion for health care professionals about when abortion is legal. In the wake of Dobbs, the best hope for women with disabilities and anyone who may become pregnant is federal legislation that protects their reproductive freedom. Without it, states led by conservative lawmakers will continue to restrict essential abortion services until little, if anything, is left.
It is important to point out that even in states that will continue to protect parents’ right to choose, providing robust reproductive health and abortion services, health care providers must do more to respond to the needs of people with disabilities. All components of clinic visits should be made accessible, and targeted educational materials made available. In addition, society must change its inaccurate and stigmatizing views of disabled people’s sexuality. Only when these harmful beliefs change will reproductive health care be truly inclusive.
Finally, many of the studies reviewed for this article call for better data collection on the pregnancy experiences of women and people with disabilities. Future research should explore how specific disabilities might influence the experiences of access, health risks, and intendedness described above.
Note: This article uses person-first and identity-first language interchangeably following reasoning provided by the Center for American Progress in their recent report addressing similar topics.
| State | Has Only One Disability Type | Has Multiple Disability Types | Total | State Ban or Likely to Ban | |||||
|---|---|---|---|---|---|---|---|---|---|
| Hearing | Vision | Cognition | Ambulation | Independent Living | Personal Care | ||||
| Alabama | 6,048 | 10,968 | 19,888 | 15,190 | 4,169 | 497 | 47,664 | 104,424 | Yes |
| Alaska | 1,132 | 1,218 | 3,020 | 1,085 | 666 | 0 | 5,473 | 12,594 | No |
| Arizona | 8,924 | 12,893 | 21,629 | 12,679 | 6,813 | 631 | 45,561 | 109,130 | Yes |
| Arkansas | 4,581 | 7,157 | 13,177 | 8,722 | 3,194 | 364 | 31,573 | 68,768 | Yes |
| California | 39,668 | 58,991 | 97,423 | 49,798 | 29,860 | 3,875 | 204,184 | 483,799 | No |
| Colorado | 7,210 | 9,491 | 17,896 | 6,889 | 5,587 | 463 | 33,263 | 80,799 | No |
| Connecticut | 3,266 | 4,746 | 12,228 | 4,299 | 2,970 | 210 | 20,836 | 48,555 | No |
| Delaware | 1,174 | 1,392 | 3,861 | 1,729 | 773 | 97 | 5,449 | 14,475 | No |
| District of Columbia | 923 | 2,554 | 2,969 | 2,012 | 433 | 77 | 4,582 | 13,550 | No |
| Florida | 20,296 | 32,038 | 58,932 | 31,504 | 14,041 | 1,911 | 125,948 | 284,670 | Yes |
| Georgia | 11,996 | 22,159 | 36,283 | 23,083 | 9,275 | 1,099 | 70,156 | 174,051 | Yes |
| Hawaii | 1,192 | 1,674 | 2,628 | 1,715 | 976 | 138 | 6,018 | 14,341 | No |
| Idaho | 2,234 | 2,880 | 6,991 | 2,679 | 2,233 | 310 | 14,903 | 32,230 | Yes |
| Illinois | 12,081 | 17,843 | 33,619 | 19,277 | 9,977 | 896 | 71,027 | 164,720 | No |
| Indiana | 8,431 | 11,069 | 27,798 | 13,840 | 6,831 | 414 | 55,776 | 124,159 | Yes |
| Iowa | 3,369 | 4,572 | 11,165 | 3,522 | 2,881 | 270 | 19,226 | 45,005 | Yes |
| Kansas | 4,261 | 5,578 | 11,912 | 4,401 | 3,262 | 199 | 22,752 | 52,365 | No |
| Kentucky | 7,249 | 10,701 | 22,357 | 12,140 | 5,663 | 294 | 50,497 | 108,901 | Yes |
| Louisiana | 6,566 | 14,638 | 21,315 | 9,890 | 4,245 | 425 | 39,908 | 96,987 | Yes |
| Maine | 1,586 | 1,600 | 6,921 | 2,163 | 2,301 | 234 | 14,115 | 28,920 | No |
| Maryland | 6,671 | 8,465 | 21,646 | 8,763 | 4,587 | 654 | 33,847 | 84,633 | No |
| Massachusetts | 7,152 | 9,550 | 28,072 | 9,460 | 6,917 | 614 | 42,654 | 104,419 | No |
| Michigan | 12,604 | 16,120 | 44,523 | 20,724 | 10,692 | 771 | 85,209 | 190,643 | Yes |
| Minnesota | 6,646 | 6,434 | 21,344 | 6,063 | 4,998 | 529 | 32,614 | 78,628 | No |
| Mississippi | 3,090 | 7,506 | 12,405 | 8,436 | 4,168 | 266 | 29,899 | 65,770 | Yes |
| Missouri | 7,112 | 10,256 | 26,241 | 12,800 | 6,009 | 417 | 51,739 | 114,574 | Yes |
| Montana | 1,481 | 1,292 | 4,276 | 1,551 | 999 | 63 | 7,317 | 16,979 | Yes |
| Nebraska | 2,414 | 3,378 | 7,113 | 2,582 | 1,455 | 131 | 11,289 | 28,362 | Yes |
| Nevada | 3,472 | 7,089 | 8,016 | 5,291 | 2,238 | 196 | 20,922 | 47,224 | No |
| New Hampshire | 1,617 | 1,588 | 5,896 | 1,802 | 1,593 | 50 | 9,782 | 22,328 | No |
| New Jersey | 6,620 | 11,758 | 20,302 | 10,076 | 5,790 | 1,074 | 41,930 | 97,550 | No |
| New Mexico | 2,498 | 4,643 | 7,575 | 3,815 | 2,648 | 295 | 18,284 | 39,758 | No |
| New York | 17,725 | 28,920 | 59,819 | 32,929 | 16,145 | 2,144 | 119,450 | 277,132 | No |
| North Carolina | 12,906 | 19,198 | 35,459 | 20,219 | 8,555 | 1,134 | 76,019 | 173,490 | No |
| North Dakota | 810 | 999 | 3,344 | 483 | 731 | 42 | 3,970 | 10,379 | Yes |
| Ohio | 14,695 | 19,393 | 53,311 | 23,697 | 11,686 | 1,263 | 96,949 | 220,994 | Yes |
| Oklahoma | 5,961 | 10,586 | 17,249 | 9,950 | 4,344 | 397 | 37,139 | 85,626 | Yes |
| Oregon | 6,600 | 6,125 | 20,727 | 6,058 | 5,903 | 374 | 34,783 | 80,570 | No |
| Pennsylvania | 15,837 | 20,491 | 59,440 | 21,698 | 14,460 | 1,637 | 105,562 | 239,125 | No |
| Rhode Island | 1,546 | 1,564 | 5,084 | 2,016 | 1,090 | 108 | 9,161 | 20,569 | No |
| South Carolina | 6,030 | 11,392 | 17,580 | 10,316 | 4,380 | 445 | 38,013 | 88,156 | Yes |
| South Dakota | 1,346 | 1,422 | 3,269 | 1,012 | 568 | 66 | 4,808 | 12,491 | Yes |
| Tennessee | 9,478 | 14,251 | 27,523 | 16,305 | 7,452 | 895 | 62,598 | 138,502 | Yes |
| Texas | 36,579 | 61,289 | 88,976 | 45,176 | 21,857 | 2,450 | 179,924 | 436,251 | Yes |
| Utah | 3,874 | 5,427 | 12,616 | 4,536 | 3,415 | 204 | 19,353 | 49,425 | Yes |
| Vermont | 1,257 | 839 | 2,689 | 1,191 | 811 | 5 | 5,156 | 11,948 | No |
| Virginia | 8,725 | 14,222 | 30,708 | 13,140 | 8,101 | 794 | 53,787 | 129,477 | No |
| Washington | 10,183 | 11,657 | 28,632 | 13,133 | 8,661 | 633 | 54,516 | 127,415 | No |
| West Virginia | 2,871 | 3,653 | 8,234 | 5,299 | 2,182 | 74 | 21,158 | 43,471 | Yes |
| Wisconsin | 6,395 | 7,223 | 23,438 | 8,368 | 5,311 | 357 | 35,287 | 86,379 | Yes |
| Wyoming | 1,290 | 974 | 2,344 | 1,177 | 519 | 55 | 4,105 | 10,464 | Yes |
| Total | 377,672 | 561,866 | 1,139,863 | 554,683 | 294,415 | 30,541 | 2,236,135 | 5,195,175 | |
Source: Author’s analysis of 2015–2019 American Community Survey 5-Year Estimates downloaded from IPUMS USA, University of Minnesota, www.ipums.org.
Note: The American Community Survey does not provide detail on respondents’ specific disabilities. Many different disabilities are represented in each of the categories presented here.
| State | Women of Reproductive Age | State Ban or Likely to Ban | ||
|---|---|---|---|---|
| Number with Any Disability | Number Low Income | Percent Low Income | ||
| Alabama | 104,424 | 63,007 | 60.3% | Yes |
| Alaska | 12,594 | 5,894 | 46.8% | No |
| Arizona | 109,130 | 58,545 | 53.6% | Yes |
| Arkansas | 68,768 | 44,231 | 64.3% | Yes |
| California | 483,799 | 239,296 | 49.5% | No |
| Colorado | 80,799 | 39,001 | 48.3% | No |
| Connecticut | 48,555 | 24,573 | 50.6% | No |
| Delaware | 14,475 | 7,059 | 48.8% | No |
| District of Columbia | 13,550 | 7,921 | 58.5% | No |
| Florida | 284,670 | 154,060 | 54.1% | Yes |
| Georgia | 174,051 | 97,014 | 55.7% | Yes |
| Hawaii | 14,341 | 6,538 | 45.6% | No |
| Idaho | 32,230 | 18,009 | 55.9% | Yes |
| Illinois | 164,720 | 86,695 | 52.6% | No |
| Indiana | 124,159 | 73,452 | 59.2% | Yes |
| Iowa | 45,005 | 25,972 | 57.7% | Yes |
| Kansas | 52,365 | 28,694 | 54.8% | No |
| Kentucky | 108,901 | 70,646 | 64.9% | Yes |
| Louisiana | 96,987 | 58,765 | 60.6% | Yes |
| Maine | 28,920 | 18,509 | 64.0% | No |
| Maryland | 84,633 | 35,974 | 42.5% | No |
| Massachusetts | 104,419 | 54,826 | 52.5% | No |
| Michigan | 190,643 | 111,656 | 58.6% | Yes |
| Minnesota | 78,628 | 41,153 | 52.3% | No |
| Mississippi | 65,770 | 42,832 | 65.1% | Yes |
| Missouri | 114,574 | 70,413 | 61.5% | Yes |
| Montana | 16,979 | 9,408 | 55.4% | Yes |
| Nebraska | 28,362 | 16,297 | 57.5% | Yes |
| Nevada | 47,224 | 25,135 | 53.2% | No |
| New Hampshire | 22,328 | 11,736 | 52.6% | No |
| New Jersey | 97,550 | 42,908 | 44.0% | No |
| New Mexico | 39,758 | 24,753 | 62.3% | No |
| New York | 277,132 | 158,253 | 57.1% | No |
| North Carolina | 173,490 | 99,144 | 57.1% | No |
| North Dakota | 10,379 | 5,685 | 54.8% | Yes |
| Ohio | 220,994 | 135,430 | 61.3% | Yes |
| Oklahoma | 85,626 | 50,650 | 59.2% | Yes |
| Oregon | 80,570 | 46,126 | 57.2% | No |
| Pennsylvania | 239,125 | 136,623 | 57.1% | No |
| Rhode Island | 20,569 | 11,910 | 57.9% | No |
| South Carolina | 88,156 | 49,736 | 56.4% | Yes |
| South Dakota | 12,491 | 7,317 | 58.6% | Yes |
| Tennessee | 138,502 | 85,600 | 61.8% | Yes |
| Texas | 436,251 | 229,773 | 52.7% | Yes |
| Utah | 49,425 | 22,968 | 46.5% | Yes |
| Vermont | 11,948 | 6,644 | 55.6% | No |
| Virginia | 129,477 | 62,670 | 48.4% | No |
| Washington | 127,415 | 62,534 | 49.1% | No |
| West Virginia | 43,471 | 29,470 | 67.8% | Yes |
| Wisconsin | 86,379 | 49,471 | 57.3% | Yes |
| Wyoming | 10,464 | 5,600 | 53.5% | Yes |
| Total | 5,195,175 | 2,870,576 | 55.3% | |
Source: Author’s analysis of 2015–2019 American Community Survey 5-Year Estimates downloaded from IPUMS USA, University of Minnesota, www.ipums.org.