Article
In a recent post at Wonkblog, Dylan Matthews takes a fairly dim view of a new paper that Larry Mishel, Heidi Shierholz, and I have written on the role of technology in wage inequality. Matthews raises several issues, but I want to focus right now on a key point that he missed: proponents of the “job polarization” view of technological change provide no evidence that the framework actually works in the 2000s. Larry, Heidi, and I will cover other issues in additional blog posts.
In his piece, Matthews focused on our criticisms of the ability of the job polarization approach to explain wage developments in the 1990s. I’ll leave the discussion of the 1990s for another day, but the more important issue for contemporary policy discussions is whether the framework is helpful at all for the last decade.
Since the occupation-based “tasks framework” that lies behind the academic research on job polarization is widely considered in the economics profession to be the best available technology-based explanation for wage inequality, Larry, Heidi, and I take the lack of evidence for this framework in the 2000s as support for our view that other policy-related factors are what is really driving inequality. We also think that if this purportedly unified framework doesn’t work well for the 2000s, that it is likely not helpful for earlier periods either.
But, even if you still think technology is the main or even an important culprit, we would argue that you need a new theory of technology that actually fits the facts of the 2000s.
This is a fairly long post and starts with some necessary background –necessary because there is a sizeable gap between the way economists talk formally about “job polarization” and the way most of the public talks about the same issue.
Some background
For about ten years, a group of economists (most prominently, MIT’s David Autor, who has been gracious and patient in his interaction with us around these issues) has argued that a particular type of technological change has been driving much of rising wage inequality.
In their view, the economy has three broad types of jobs: abstract cognitive jobs (think lawyers, doctors, managers), routine jobs (think manufacturing or many clerical jobs), and non-routine manual jobs (think restaurant workers or office cleaners).
Historically, a lot of good middle-class jobs were in the “routine” category: manufacturing or clerical and administrative jobs that offered decent pay and benefits to workers with a high school degree and sometimes even less than that. Computers and robots and other recent technological innovations, the argument goes, are an excellent substitute for workers who do these kinds of routine manual and routine cognitive tasks. As a result, the advance of technology has dried up the stock of middle-wage jobs and put downward pressure on the wages of workers in the middle of the skill distribution.
These same technological developments, per this approach, almost certainly have made abstract workers more productive. Lawyers, doctors, managers and other professionals now have vast processing power at their disposal, strongly complementing their training in all kinds of abstract problem-solving. These changes in work should, the argument goes, raise the employment and wages of workers in high-skilled occupations and increase the earnings gap between those jobs and those at the middle.
Meanwhile –these same economists argue– computers and robots have made few inroads into non-routine, manual jobs, such as food service and cleaning –the kinds of services that are typically provided in-person (so they can’t be easily outsourced either). Technology might not be helping these workers –who are about 15 percent of the workforce– but technology isn’t undercutting them either. With technology driving down employment in the middle and having no important impact on employment at the bottom, this framework predicts that the wage gap between workers in the middle and the bottom should be falling.
The end result of these forces –strongly rising demand for jobs at the top, falling demand for jobs in the middle, and rising demand for jobs at the bottom– is, in this view, a “polarized” occupational employment structure with expanding high and low-wage occupations and a shrinking middle.
As it happens, this is a reasonably close approximation of what appears to have happened to wages in the 1990s. The wage gap between workers at the top and the middle continued to grow rapidly, as it had in the 1980s. But, the wage gap between workers in the middle and the bottom shrank, reversing the pattern of widening inequality between the middle and the bottom that had prevailed in the 1980s. (The doubts we have about the 1990s concern the description of the employment patterns, not these wage trends.)
Economists call the expansion of employment at the top and the bottom at the expense of the middle “employment polarization” and the rise of wages at the top and the bottom relative to those in the middle “wage polarization.” Employment polarization is relevant to the discussion of wage polarization to the extent that changes in employment patterns are driving changes in wage patterns.
The question
The question that we ask in our paper is how well does this particular technological explanation of wage inequality hold up to the data?
Let’s start with the most recent version I could find of the iconic chart of occupational employment polarization that is the starting point for this entire view of the labor market. The figure below, taken from a 2012 paper by David Autor and David Dorn, shows (on the vertical axis) changes between 1980 and 2005 in the employment share of occupations arranged by the “skill level” of the occupation (along the horizontal axis).
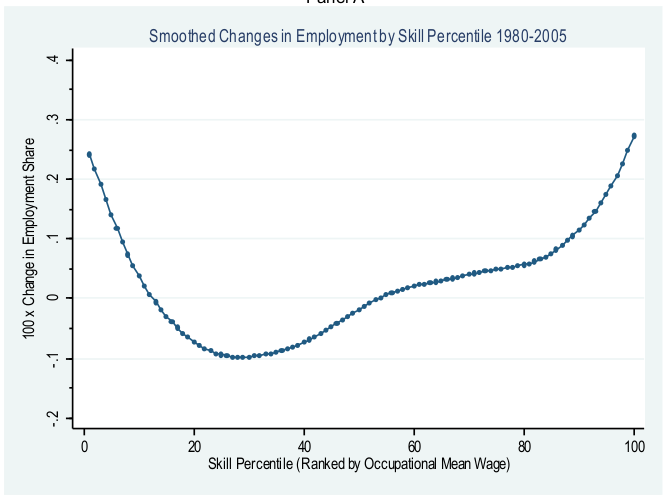
There are two important things to note about the line. First, it has a fairly well-defined U-shape. This suggests that employment in high-skilled occupations (which are measured by each occupation’s average wage in 1980) was rising more rapidly than employment in middle-skilled occupations. Importantly, the line also shows that employment was growing more rapidly in less-skilled occupations than it was in middle-skilled occupations.
So far, this fits nicely with the “job polarization” story.
Second, the data combine trends for the 1980s, the 1990s, and the 2000s (through 2005).
When the data are broken down by decade (which roughly correspond to three separate business cycles), however, we see three very different stories. Here is a version of the figure presented by David Autor in a 2010 paper prepared for the Hamilton Project and the Center for American Progress.

The data for the 1990s (the light green line) trace a U-shaped pattern that looks a lot like the iconic graph for the longer period from 1980 through 2005. In our paper, we raise several concerns about the shape and the robustness of this result for the 1990s, an issue that Matthews focuses on his piece, but my arguments here rely only on the data as presented by David Autor and his co-authors.
The 2000s
What is striking about this graph, however, is that the data for the 2000s (the dark green line) do not show a U-shaped pattern. Instead, the 2000s follow something closer to an L-shape, with expanded employment at the bottom and small declines in employment at the middle and the top.
This occupational employment pattern for the 2000s is a major challenge to the “job polarization” framework and forms the basis of one of the core arguments in our paper.
First, as is obvious, the data actually show no signs of job polarization in the 2000s. Employment expanded in low-wage occupations, but was flat or falling in middle- and high-wage occupations. It is hard to appeal to “job polarization” as an explanation for widening wage inequality in recent years when the data used to establish occupational employment polarization for the 1990s also show that polarization stopped by the 2000s.
Second, the occupational employment patterns for the 2000s are also inconsistent with key movements in the overall wage distribution. If changes in occupational employment are useful for predicting changes in overall wage inequality, based on the pattern in the figure above, we would have expected that: (1) wages at the bottom would have grown sharply relative to those at the middle; and (2) wages at the top would have grown at roughly the same pace as wages at the middle.
The actual change in the wage distribution, however, did not look anything like this. Between 2000 and 2007, inflation-adjusted wages of workers at the bottom (the 10th percentile) grew 2.6 percent, wages at the middle grew 2.5 percent, and wages of workers at the top (the 90th percentile) grew 7.6 percent. So, contrary to what the job polarization view would suggest: (1) wages at the bottom did not grow faster than wages in the middle and (2) wages in the middle fell further behind wages at the top.
Both of these patterns are awkward for the job polarization view of technology. Low-wage occupations saw big employment gains, but these did not translate into rising relative wages for low-wage workers. This outcome suggests that something other than technologically-driven occupational employment trends are driving changes at the bottom of the overall wage distribution.
High-wage occupations saw no change in their employment share, but high-wage workers experienced much more rapid wage growth than those at the middle (and the bottom). As was the case at the low-end of the wage distribution, something other than occupational employment changes appears to be driving overall wages at the top of the distribution.
These patterns for the 2000s –the lack of any actual job polarization and the lack of correspondence between occupational employment changes and changes in the overall wage distribution– raise serious questions about the usefulness of the tasks framework for current policy discussions.
Our view is, instead, that other factors are actually driving inequality, overwhelmingly related to policy issues. But, even if you think technology is still the main culprit, the data for the 2000s clearly suggest that this particular version of the theory is not relevant to current conditions. Technology-driven job polarization is, at best, a story of the 1990s.
This has been cross-posted at the EPI Blog