November 23, 2016
In 2007, before the Great Recession, the unemployment rate was 4.6 percent. The employment rate ? the percentage of all Americans age 16 and older who had a job ? was 63.0 percent. By 2010, the unemployment rate had risen to 9.6 percent, and the employment rate had dropped to 58.5 percent. Since then, a weird thing has happened. Although unemployment has fallen back to 4.9 percent ? just 0.3 percentage points above the 2007 average ? the employment rate has remained stubbornly low.
Looking at the data more closely, it is clear what is driving these seemingly incompatible trends: people are dropping out of the labor force. In order to be counted as unemployed, a prospective worker must have “actively looked for work in the prior 4 weeks.” This means that if someone has been searching for work for a long period of time, but has become dissatisfied with their job prospects and hasn’t applied for any jobs over the past month, he or she is no longer counted as “unemployed.” Instead, that person will be counted as “not in the labor force,” a classification that covers people who are neither employed nor unemployed. The share of the population not in the labor force has risen from about 34 percent in 2007 to over 37 percent today.
If the long-term unemployed drop out of the labor force due to discouragement over their job prospects, employment is a more useful measure than unemployment. However, the overall employment rate doesn’t adjust for the changing age distribution of the population; with more Americans hitting retirement age, we expect employment to fall not because workers have relatively few job opportunities, but simply because people in their sixties, seventies, and eighties prefer retirement to work.
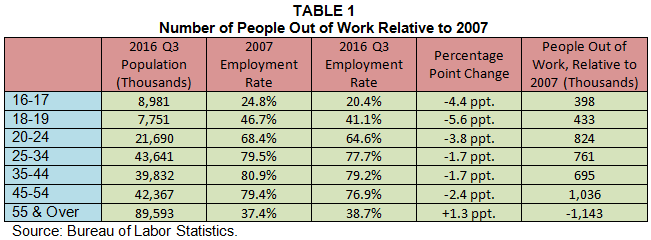
While aging explains a significant part of the overall drop in employment, it can’t explain the drop within various age groups. In order to determine how many Americans have lost their jobs due to the recession, Table 1 compares the employment rates from 2007 and the third quarter of 2016 by age group. Employment is down for Americans ages 16 to 54, but is up for those 55 and older.
Of course, that calculation doesn’t account for rising school enrollment among young people. In the short term, growing rates of both high school and college enrollment will push down employment (even if it ends up helping the economy in the long run). For example, over the past 12 months, the employment rate among 20–24 year-olds enrolled in school has been 47 percent; among those not enrolled in school, it has been 74 percent.
Table 2 shows how many people are out of work relative to 2007 after we adjust for rates of school enrollment for 16–24 year-olds. Because enrollment is actually down slightly among 16–19 year-olds, the gap between their 2007 and 2016 Q3 employment rates actually increased by 0.1 percentage points; by contrast, the more substantial growth in enrollment among 20–24 year-olds pushed their employment rate down by almost half a percentage point. (The data for 16–19 year-olds have also been adjusted for the fact that more of today’s 16–19 year-olds fall into the 18–19 sub-category than in 2007.)
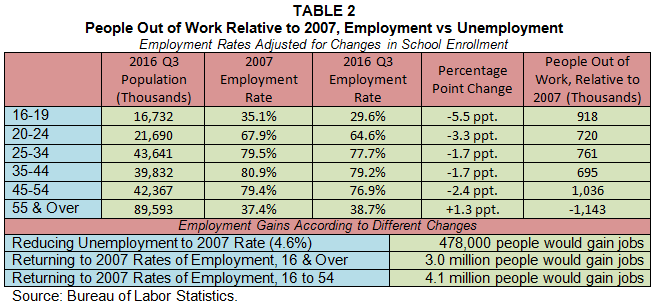
Looking at the unemployment rate, we’d assume that only an additional 478,000 people are out of work relative to 2007. However, when we look at rates of employment, we see that 3 million people remain jobless. The situation is even worse if we discount rising employment among seniors: overall, about 4.1 million people ages 16 to 54 remain locked out of the job market. (There is at least some empirical evidence suggesting that older and younger workers are complements, not substitutes, so rising employment among seniors may not preclude higher employment for the 16–54 group.)
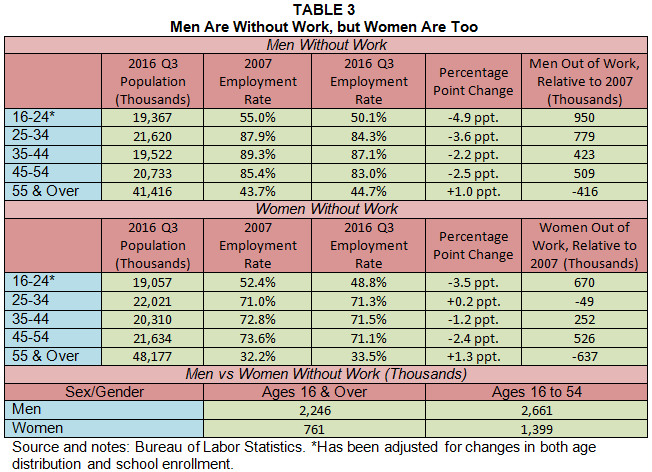
There is one last point worth noting. A lot of recent news articles have focused on why men aren’t working, with most of them hypothesizing that men are choosing not to work because they’d rather play video games, watch porn, etc. There is one big hole with these theories: the cause of low employment can’t be specific to men, since women have seen a large drop in employment as well. In fairness to the “men without work” crowd, the drop in employment for men has been larger than the drop among women ? in fact, depending on whether we use the 16–54 group or the overall population, the drop has been two to three times as great for men as for women. However, even if the decrease hasn’t been as large, this should not distract from the fact that we are still talking about a decrease. Clearly whatever is affecting women is also affecting men, just to a greater degree. This can be seen in Table 3, which shows changes in employment rates for men and women separately. The problem is not that male workers are leaving their jobs ? the problem is that the jobs are leaving the workers, be they men or women.