

May 24, 2022

Every May the US commemorates and recognizes the role of Asian Americans and Pacific Islanders (AAPI) in modern society. But this year, the pandemic-fueled surge in anti-Asian violence creates a critical moment to rethink issues like occupational segregation and employment discrimination.
Asians and Pacific Islanders are one of the fastest-growing ethnic and racial groups in the United States. Yet, the role that low-income, less-educated AAPI women play in the US workforce receives relatively little attention. This article puts a spotlight on this vulnerable group and their workplace status as the economy recovers.
Apart from certain subgroups of the AAPI community working professional jobs, the prevalence of AAPI women working as registered nurses reveals that AAPI women, and women in general, were the backbone of the frontline workforce during the pandemic outbreak. On the other extreme, there are many AAPI women in certain low-wage occupations, such as service- and care-related jobs.
As we previously documented, even though AAPI unemployment seems relatively comparable to white unemployment, AAPI workers had a much more difficult time getting reemployed once they became unemployed. Even after adjusting for workers’ characteristics, the rate of job entry for unemployed AAPI women is lower during 2021 and the first quarter of 2022, compared to AAPI men and other racial and ethnic groups. (see Table 1).
Although there was not much of a gender difference month-to-month when comparing the likelihood of getting reemployed among the AAPI population in 2021, results from the first quarter of 2022 reveal that female AAPI workers are the least likely to transition into a job. It is substantially lower than their male counterparts, as well as Hispanic and white workers. This may imply some employment discrimination. As more data become available, it will be interesting to track long-term trends for various subgroups to obtain a more reliable picture as the economic recovery continues to unfold.
| AAPI Women | AAPI Men | Black | Hispanic | White | |
|---|---|---|---|---|---|
| First half 2021 | 23.4 | 22.9 | 20.5 | 27.5 | 25.4 |
| Second half 2021 | 22.4 | 22.2 | 23.6 | 31.4 | 29.2 |
| First quarter 2022 | 24.5 | 31.7 | 24.3 | 35.2 | 30.5 |
Source: Author’s calculation from the monthly Current Population Survey (available at IPUMS-CPS, University of Minnesota, www.ipums.org). Work transition is measured through month-to-month transition from unemployment to employment. Results adjusted for workers’ age, education attainment, and state of residence. AAPI, Black, and white groups do not include individuals who identify as Hispanic.
Occupation and income poverty data show substantial differences between the AAPI Asian and Native Hawaiian and Pacific Islander (NHPI) subgroups.
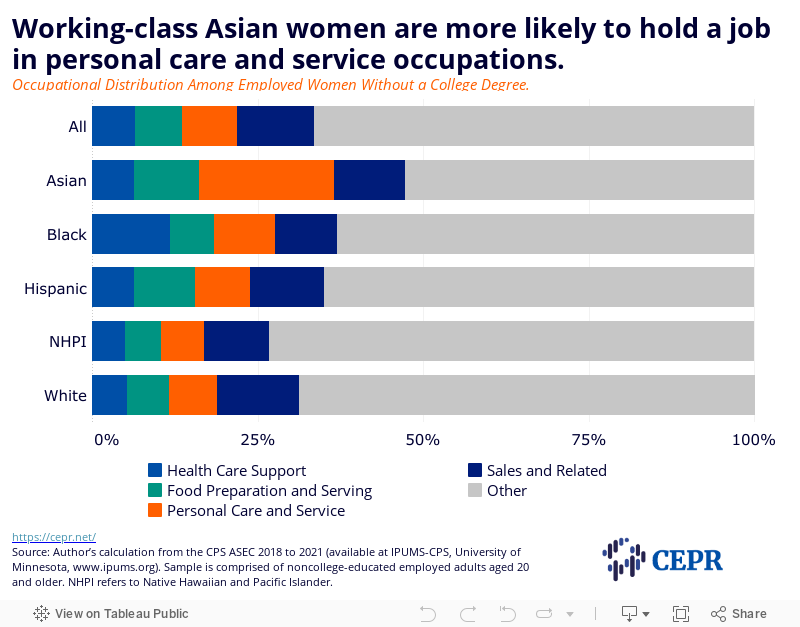
Asian women (20 and older) without a college degree are more likely than other racial and ethnic working-class women to hold a job in personal care and service occupations or food preparation and serving occupations (see Figure 1). The lack of a college degree is used as a proxy to capture the working class.
These jobs include, but are not limited to, food preparation workers, servers, hairdressers, personal care aides, and childcare workers. These two occupations comprise over 30 percent of employed Asian women with less than a college degree. Working-class women in other races or ethnicities have a lower percent employed in these occupations: NHPI (15 percent), Black (16 percent), Hispanic (20 percent), and white (19 percent).
Figure 1
Using the supplemental poverty measure (SPM), a noticeable decline in the poverty rate is found for both the overall population and the AAPI community through time. The most recent three years of data suggest that the adult AAPI population’s poverty rate is quite close to the national average (see Table 2). However, gender and education attainment seem to exacerbate the economic disparity within the AAPI population.
We observe an elevated poverty rate for AAPI women without a college degree. On average, approximately 17.5 percent of AAPI women with less than a college degree lived in households with disposable income under the poverty line between 2018 and 2020. Among women 20 or older, this is 3 percentage points higher than all working-class women, and nearly 7 percentage points higher than all women nationwide.
When further disaggregating them into Asian and NHPI groups, this strikingly high poverty rate for the AAPI women without a college degree appears to be mostly attributable to the Asian women subgroup, while NHPI women have a relatively modest poverty rate.
Less educated Asian women’s relatively high representation in low-wage personal care jobs may suggest that working-class Asian women are more likely to be impoverished, relative to their NHPI peers.
| 2013-2015 | 2018-2020 | |
|---|---|---|
| National average | 14.0 | 10.2 |
| AAPI population | 14.4 | 10.6 |
| All women | 15.1 | 11.1 |
| All women w/o college degree | 18.8 | 14.4 |
| AAPI Women w/o college degree | 21.5 | 17.5 |
| Asian Women w/o college degree | 21.9 | 17.9 |
| NHPI Women w/o college degree | 15.9 | 13.0 |
Source: Author’s calculation from the CPS ASEC 2014–2016 and 2019–2021. Full-time students and respondents below 20 are not included in the sample. NHPI refers to Native Hawaiian and Pacific Islander.
The overall AAPI unemployment and income poverty statistics may mask the real economic disparity faced by Asian women within the AAPI population stratified by education and gender. Economic prospects for low-income, less-educated AAPI women, as well as working-class women of other races and ethnicities deserve more attention from policy makers.
As the economy recovers, it is crucial to modernize the labor market and provide policy responses that offer better paying jobs with greater security, and better scheduling provisions in service sector occupations. These jobs employ overwhelmingly working-class women. Such policies would lay the cornerstone for an inclusive post-pandemic economy.

