Article
In March of last year, CEPR released a series of five measures tracking the rate of recovery from the 2008 recession. The series was created in order to show that the labor market is much weaker than the unemployment rate implies.
The five measures have been updated every month at CEPR’s Graphic Economics page after each new jobs report. However, we have modified the series in two ways for the latest jobs figures. These modifications are described below.
Using 2007 Annual Data as Our Starting Point
In CEPR’s “Real Rate of Recovery” series, we determine both the degree to which the economy weakened during the recession and also the extent of recovery since then. In our original series, we used December 2007 — officially the first month of the recession, according to NBER — as our starting point for the pre-recession state of the economy. However, it appears that the economy began weakening even before December 2007. For example, the prime-age employment rate averaged 79.9 percent during 2007 as a whole, but had fallen to 79.7 percent by December. The unemployment rate itself exhibits this tendency, as it jumped from 4.7 to 5.0 percent between November and December.
December 2007 is a flawed starting point, as the economy had already begun shedding jobs by then. Therefore, we have updated our series by taking the average annual data for 2007 as our starting point. This changes our calculations somewhat, as it means that the economy worsened more significantly between 2007 and the recession’s trough than we had originally estimated.
Changing the Age Breakdowns for the Age-Adjusted Employment Rate
In CEPR’s original age-adjusted employment rate, we used employment data for the following six age groups: 16 to 24, 25 to 34, 35 to 44, 45 to 54, 55 to 64, and 65 years and older. Seasonally adjusted data were used for all age groups except for 55-64 and 65+.
We have updated this series in two ways. First, we have broken the 16–24 age group into three groups: 16–17, 18–19, and 20–24. There are large differences in employment patterns between these age groups. This breakdown takes that into account.
In the same vein, we have started breaking down the over 55 group into five separate age groups: 55–59, 60–64, 65–69, 70–74, and 75 years and older. Unfortunately, BLS does not publish seasonally adjusted data for these more narrow age brackets, however there seems to be little difference between summing the unadjusted data and the seasonally adjusted number for the over age 55 population published by BLS.
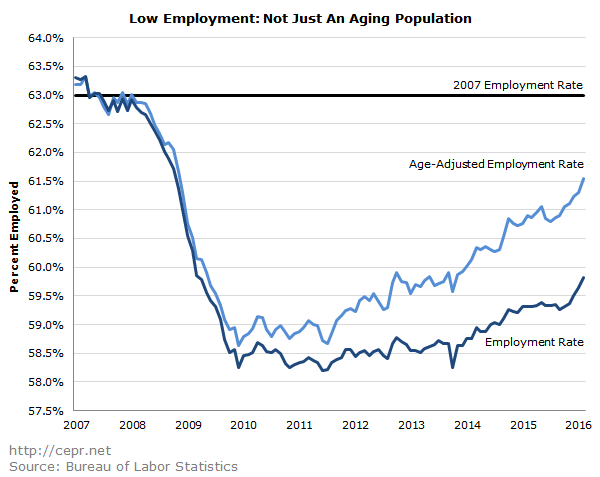
The figure below compares the age-adjusted employment rate to the actual employment rate as well as the 2007 employment rate. About half the gap between the 2007 employment rate and today’s employment rate can be attributed to the aging of the population rather than the weakness of the economy. Notwithstanding this fact, there is a significant gap between the 2007 employment rate and today’s age-adjusted employment rate. Between 2007 and December 2009, the age-adjusted employment rate fell 4.3 percentage points. In the six-plus years since, we have recovered about two-thirds of the lost employment. Clearly the labor market is mostly recovered; but even if we continue growing at the same rate as we did last year, the economy won’t fully recover for another two years. This is still very much a depressed job market.