

May 05, 2016
This Friday morning, the Bureau of Labor Statistics will release the latest jobs figures for the month of April. The unemployment rate and the number of jobs created will likely be the major focuses of most reporting.
But there is an important and less noticed problem in today’s economy. Specifically, the weakness of the current labor market has less to do with high unemployment and more to do with high underemployment.
Part of this underemployment can be attributed to the rise of involuntary part-time employment. In 2007, involuntary part-time employment constituted about 3 percent of total employment. It spiked during the recession and reached a peak of 6.7 percent in March 2010. While involuntary part-time employment has come down significantly since then, it still represented over 4 percent of total employment last month — a rate that is over one-third higher than the pre-recession average.
Another underreported story is that far more of today’s unemployed workers want full-time jobs than we would expect given 5.0 percent unemployment. While unemployment among workers seeking both full-time and part-time jobs increased dramatically during the recession, unemployment for those seeking part-time jobs has since returned to normal levels, while unemployment for those seeking full-time jobs remains high.
Figure 1 below shows unemployment for those seeking full- and part-time jobs along with involuntary part-time employment — the three measures of labor underutilization — for the first four months of every year from 1995 to 2015. Also included is data from the first three months of 2016 (after tomorrow, we will have data on the first four months). The three measures are taken as shares of the civilian labor force, which includes everyone who is either employed or searching for work (unemployed).
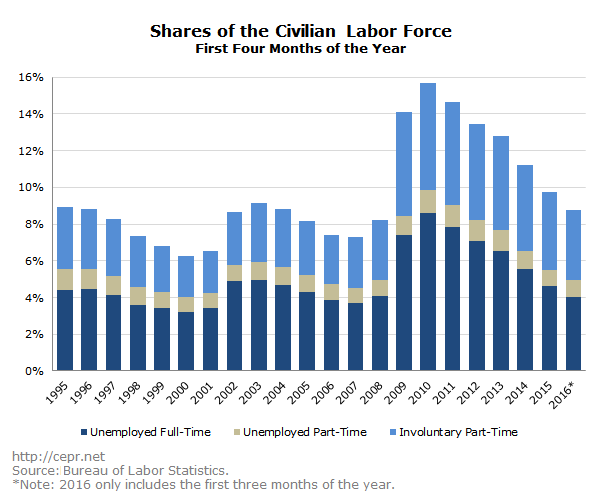
Although the labor market is clearly improving, there is far more unused labor than the unemployment rate implies. Through the first three months of 2016, unemployment has averaged 4.9 percent. From 1995 to 2015, the only six years with lower unemployment rates during the first four months of the year were 1998–2001, 2006, and 2007. Notably, the unemployment rate for those seeking part-time jobs in 2016 (0.9 percent) is the same as the average rate from those six years. What distinguishes 2016 from those low-unemployment years is the high degree of both involuntary part-time employment and unemployment among those seeking full-time work. This can be seen in Figure 2 below.
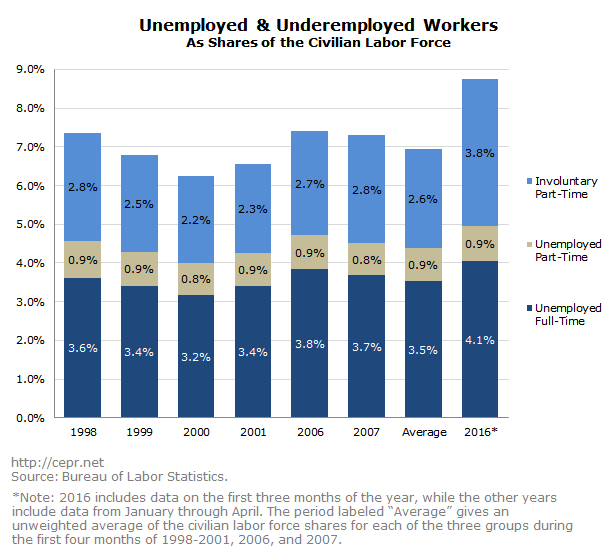
In previous years with a strong labor market, unemployment for those seeking full-time work averaged 3.5 percent and remained in the range of 3.2 to 3.8 percent; so far this year, it has been 4.1 percent. And just as notably, involuntary part-time workers currently make up 3.8 percent of the civilian labor force. This is outside of the 2.2 to 2.8 percent range from the other six years.
We can see how the degree of underemployment diverges from the unemployment rate by creating an “Unworked Hours Rate.” This has been done using data on hours worked from the Bureau of Labor Statistics (BLS). The BLS tracks the average weekly hours of full-time workers, voluntary part-time workers, and involuntary part-time workers. (The distinction between voluntary and involuntary part-time workers is that the former want part-time jobs, whereas the latter want full-time jobs but are stuck working fewer hours than they would prefer.) With a little bit of arithmetic[1,2,3] we can figure out how many hours are being worked and compare it to the number of hours that people would like to work. The Unworked Hours Rate functions as a parallel measure to the unemployment rate, with the two being calculated as follows:
(Unemployed Workers) / (Unemployed Workers + Employed Workers) = Unemployment Rate
(Unworked Hours) / (Unworked Hours + Hours Worked) = Unworked Hours Rate
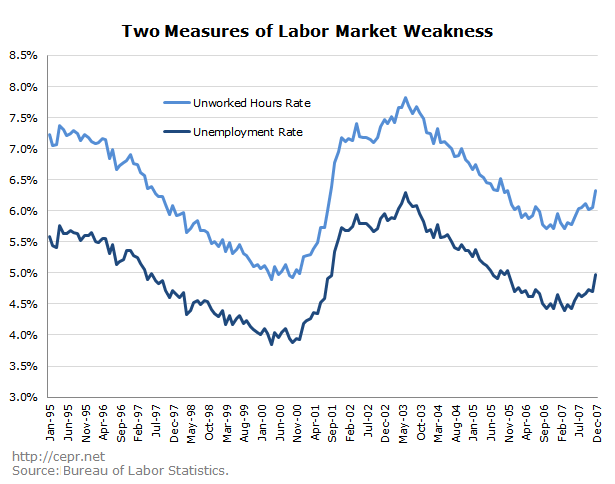
Figure 3 compares the Unworked Hours Rate to the unemployment rate from 1995 to 2007. While the Unworked Hours Rate was always higher than the unemployment rate, the two moved in tandem. The Unworked Hours Rate was consistently higher than the unemployment rate by a factor of 1.27.
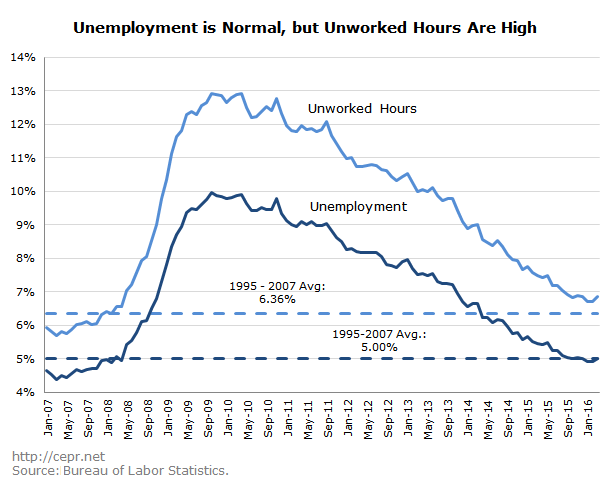
However, since the 2008 recession, an oddity has emerged in the data. While both measures spiked during the recession and have fallen throughout the recovery, the unemployment rate has recovered to a greater degree than the Unworked Hours Rate. As of last March, the unemployment rate had actually fallen all the way to its 1995–2007 average. By contrast, the Unworked Hours Rate was 0.5 percentage points above its average rate from the same period. The March 2016 Unworked Hours Rate of 6.9 percent is more consistent with an unemployment rate of 5.4 percent than 5.0 percent. This shows that while unemployment may have basically recovered, underemployment is still a serious problem in today’s economy.
[1] The number of hours worked is calculated as follows: (Average Weekly Hours of Full-Time Workers) x (Number of Employed Full Time Workers) +(Average Weekly Hours of Voluntary Part-Time Workers) x (Number of Voluntary Part-Time Workers) + (Average Weekly Hours of Involuntary Part-Time Workers) x (Number of Involuntary Part-Time Workers).
[2] The number of unworked hours is calculated as follows:
(Average Weekly Hours of Full-Time Workers) x (Number of Unemployed Full-Time Workers) + (Average Weekly Hours of Voluntary Part-Time Workers) x (Number of Unemployed Part-Time Workers) + (Average Weekly Hours of Full-Time Workers – Average Weekly Hours of Involuntary Part-Time Workers) x (Number of Involuntary Part-Time Workers).
[3] The data on hours worked are not available on a seasonally adjusted basis. Therefore, when estimating the average weekly hours of full-time workers, voluntary part-time workers, and involuntary part-time workers, I use a 12-month moving average. Because I need 12 months of data for my calculations and the series on the average weekly hours of full-time workers only goes back to January 1994, the Unworked Hours Rate is first calculated for 1995.

