

May 23, 2012

Unionization rates — and the gender and racial composition of unionized workers — vary widely across the 50 states and the District of Columbia. In a newly released issue brief, based on an analysis of the Current Populations Survey, we give an overview of the size and basic demographics of the unionized workforce in each state. The brief is a partial update of some of the numbers that appeared in a 2010 release CEPR report called “Unions of the States.”
Size of the States’ Union Workforces
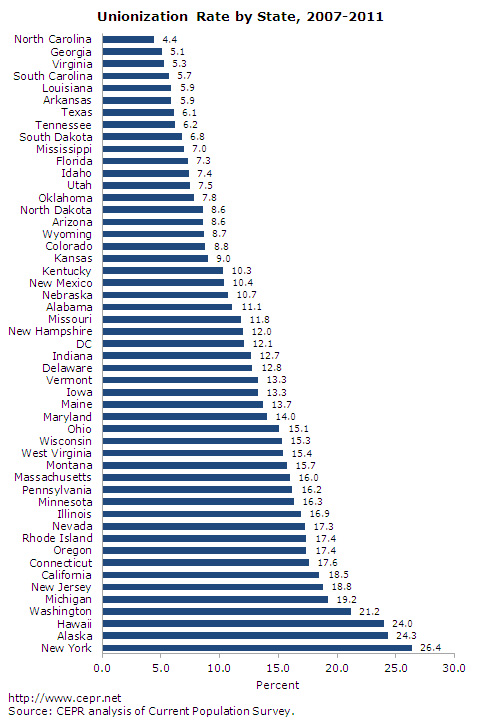
The figure below (Figure 2 in the new brief) shows the average unionization rate in each state over the years 2007-2011. We define a unionized worker as anyone who is a member of a union or represented by a collective bargaining agreement.
In 2007-2011, the 13.3 percent of the U.S. workforce was unionized. New York state had the highest unionization rate, at 26.4 percent. Alaska (24.3 percent) and Hawaii (24.0 percent) followed closely. Only one other state had a unionization rate above 20 percent and that was Washington (21.2 percent). The rest of the top ten most unionized states were Michigan (19.2 percent), New Jersey (18.8 percent), California (18.5 percent), Connecticut (17.6 percent), Oregon and Rhode Island (17.4 percent each), and Nevada (17.3 percent). Eight states had a unionization rate that was less than half of the national average: Tennessee (6.2 percent), Texas (6.1 percent), Arkansas and Louisiana (5.9 percent each), South Carolina (5.7 percent), Virginia (5.3 percent), Georgia (5.1 percent) and North Carolina (4.4 percent).
See the full brief for data on the number of union workers and their racial and ethnic background, by state.

