

July 26, 2017

Last week four prominent Republican economists, John Cogan, Glenn Hubbard, John Taylor, and Kevin Warsh released a short paper arguing that it would be possible to have substantially more rapid growth if we cut taxes and reduced regulation. A big part of their story was that we would see substantially more labor force participation if workers faced lower tax rates, and therefore got to keep a larger share of their pay.
While there are many factors that affect people’s decision to work other than tax rates, such as before tax pay and access to child care, it is worth looking at what happened to employment in the years following the tax cuts put in place by President George W. Bush in 2001. This is an interesting question because President Clinton raised taxes in 1993, although the tax increase almost exclusively affected upper income people. Nonetheless we can compare a higher tax period, 1993-2001, with a lower tax period, 2001-2012. Taxes for high-end earners rose in 2012.
Figure 1 below shows the employment-to-population ratio (EPOP) for prime-age (ages 25-54) men and women.
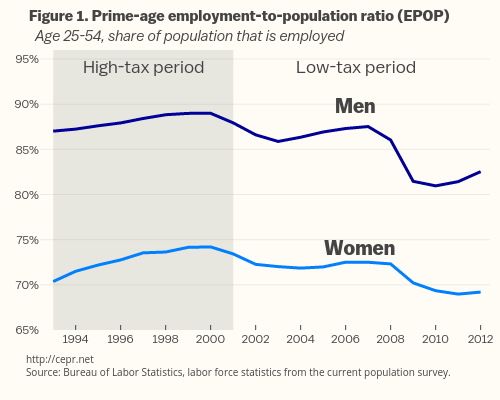
As shown, EPOPs for both groups rose in the high tax years from 1993 to 2000, roughly 2.0 percentage points for men and 4.0 percentage points for women. By contrast, EPOPs fell in the lower tax period from 2001 to 2012, dropping by more than 5.0 percentage points for prime-age men and more than 4.0 percentage points for prime-age women.
Figure 2 shows EPOPs over these periods for white, Black, and Hispanic prime-age men in the high tax and low tax period.
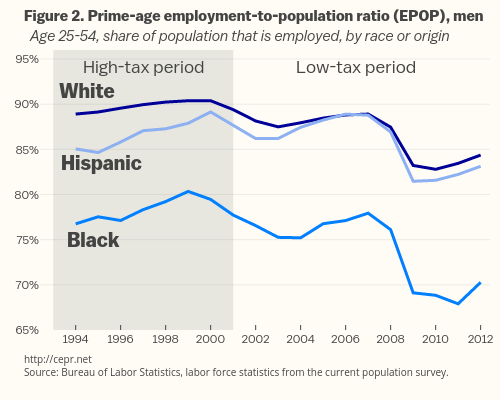
The EPOP for prime-age white men rose by a bit more than 1.0 percentage point in the period from 1993 to 2001. For Blacks the EPOP rose by almost 3.0 percentage points, and for Hispanics it rose by more than 4.0 percentage points.
These gains were completely reversed in the low tax years. From 2001 to 2012 the EPOP for prime-age white men fell by 5.0 percentage points. For Black prime-age men, the drop was more than 7.0 percentage points and for Hispanic men, more than 4.0 percentage points.
Figure 3 shows the same breakdowns for prime-age women over these periods.
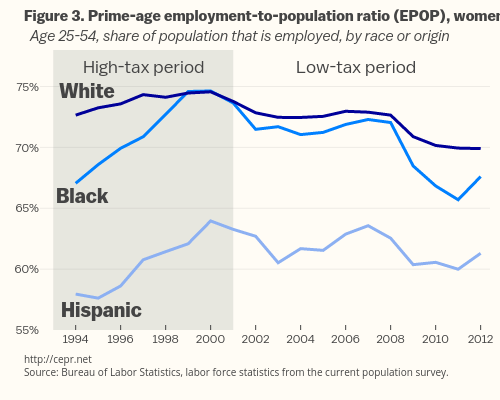
The EPOP for prime-age white women rose by almost 2.0 percentage points in the high tax period. For prime-age Black women, it rose by more than 7.0 percentage points and for Hispanic women, it rose by 6.0 percentage points. As with men, these gains were largely reversed in the low tax period. The EPOPs for prime-age white women fell by 2.0 percentage points, for Black women, by more than 6.0 percentage points and for Hispanic women by more than 4.0 percentage points.
Figures 4a and 4b give EPOPs for more narrow age groups for men in the high tax and low tax period.
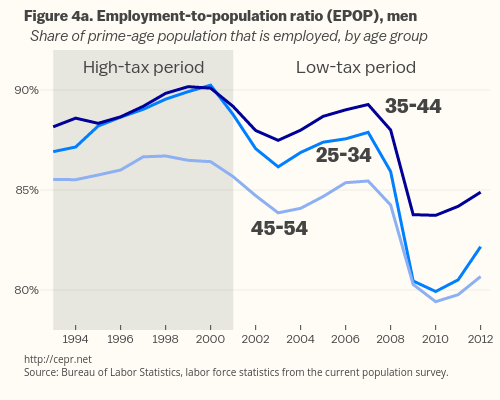
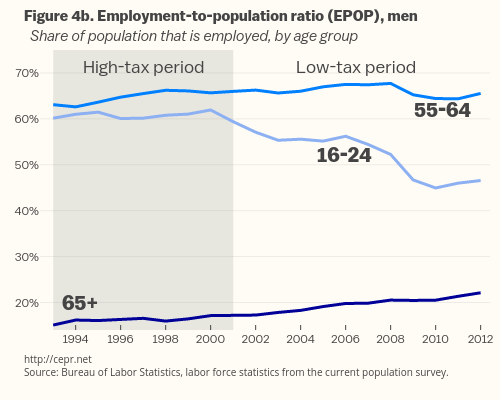
Figure 4a shows small gains in EPOPs in the high tax period for the 25 to 34, the 35 to44, and 45 to 54 age groups in the high tax period. These three age groups all had declines of more than 4.0 percentage points in their EPOPs in the low tax period.
Figure 4b shows the EPOPs for men between 16 to 24, 55 to 64, and over age 65. These groups had small increases in their EPOPs in the high tax period. The EPOP for the youngest age cohort fell by almost 13.0 percentage points in the low tax period. The EPOP for men aged 55-64 fell slightly during the low-tax period. The EPOP for men over age 65 continued to rise in the low tax period.
It is worth noting that this is in part due to the post-war baby boom cohorts entering this age range. This group was far more likely to be college educated than the previous cohort. College educated workers typically have less physically demanding jobs and also jobs that they find rewarding. Therefore they tend to work later into their life.
Figures 5a and 5b provide the same age breakdowns for women’s EPOPs in the high tax and low tax period.
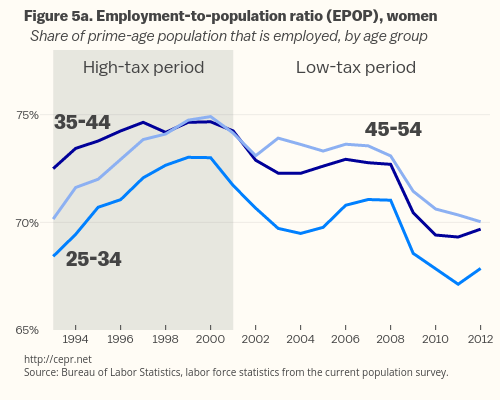
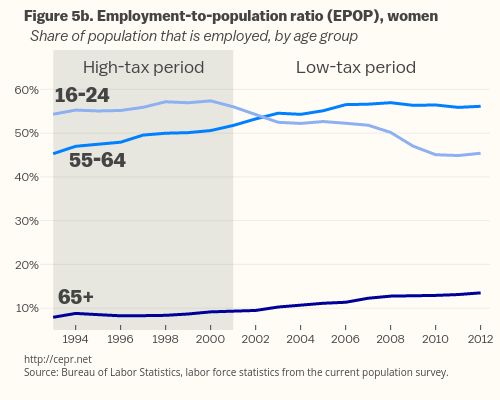
Figure 5a shows a sharp rise in the EPOP for women between the age of 45 and 54 and between the age of 25 and 34 in the high tax period and somewhat smaller increases for women between the ages of 35 to 44. The EPOP for these three groups falls in the low tax period by around 4.0 percentage points.
Figure 5b shows the EPOPs for women between the ages of 16 to 24, between the ages of 55 to 64, and over age 65 in the high tax and low tax period. All three rise in the high tax period. The EPOP for women between the ages of 55 and 64 and over age 65 continues to increase in the low tax period. By contrast, the EPOP for women between the ages 16 to 24 falls by more than 10 percentage points in the low tax period.
The pattern shown in these figures does not inspire confidence in the view that lower tax rates will lead more people to work. It is likely that the main reason that EPOPs fell after 2000 was due to less demand in the economy. The late 1990s was fueled by a stock market bubble. This demand was briefly replaced in part by the housing bubble, but since the bubble’s collapse, and the resulting recession, the economy has arguably been constrained by a lack of demand, which means that workers see fewer employment opportunities.
While the main factor determining employment rates may have been demand, there is little evidence of any supply side effect from the 2001 tax cut. More workers in almost every age group were willing to work in the relatively higher tax 1990s than are working now. There are obviously other factors that complicate the story, but the experience of the last quarter century certainly does not support a simple story whereby lower tax rates lead to more willingness to work.

