January 13, 2014
University of Massachusetts economist Arindrajit Dube (on leave this spring at MIT) has an excellent new paper looking at the impact of the minimum wage on the federal poverty rate.
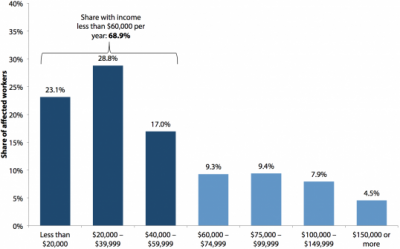
In the past, I have generally relied on analyses along the lines of this recent chart prepared by the Economic Policy Institute’s David Cooper to assess the distributional impact of increases in the minimum wage.
To produce the chart, Cooper looked at all of the workers now earning between the current federal minimum wage ($7.25) and the new level under consideration in Congress ($10.10). He then summed the implied increase in workers’ incomes (ignoring any possible changes in employment) and allocated those gains to the families by their original income levels.
According to Cooper’s analysis, almost 70 percent of the benefits go to families with incomes of less than $60,000. More than half go to families with incomes below $40,000. Not quite one fourth, to families with incomes below $20,000.
Dube’s new paper, however, goes further. He measures what actually happened to family incomes after federal and state minimum wage increases between 1990 and 2012 –including any changes in the level or the composition of employment in response to the minimum wage.
Dube finds that a 10 percent increase in the minimum wage is associated, on average, with a 1.2 to 3.7 percent decrease in the federal poverty rate. His best estimate of the short-run effect (the first year) is about a 2.4 percent decline in poverty; his best estimate of the longer-run effect (after one year) is a 3.6 percent reduction in poverty.
Dube uses these estimates to forecast the impact of the proposed legislative increase in the federal minimum wage to $10.10 per hour:
Starting from the current 17.5 percent poverty rate among the non-elderly population, the estimates suggest a 1.7 percentage point reduction in the poverty rate from a 39 percent increase in the minimum wage as proposed in the legislation. [In the longer-term] the estimates suggest a somewhat larger reduction of 2.5 percentage points. Given the roughly 275 million non-elderly Americans in 2013, the proposed minimum wage increase is projected to reduce the number of non-elderly living in poverty by around 4.6 million, or by 6.8 million when longer term effects are accounted for.
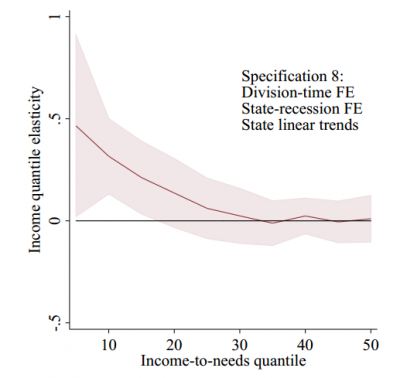
When Dube expresses these results in terms of family incomes (rather than relative to the federal poverty line), the results reinforce Cooper’s finding that the benefits of minimum-wage increases are concentrated in the bottom of the income distribution. The chart below shows the impact of a minimum-wage increase on families at different income levels. The increases are largest for families below the 10th percentile of the income(-to-needs) distribution and fall off slowly until basically disappearing at round the 30th percentile.
Media accounts of Dube’s paper highlighted these important findings, but I would also emphasize one issue that has not received as much attention as it deserves. The paper includes a review of 12 studies that have examined the connection between poverty and the minimum wage –and these overwhelmingly point to the possibility that the minimum wage reduces poverty. (The 12 studies are every one Dube could identify where the information provided would allow him to calculate a poverty-to-minimum-wage elasticity and a corresponding standard error.) Dube’s paper provides a detailed discussion of this earlier research, but his summary is particularly helpful:
First, … across these 12 studies, nearly all (48) of the 54 estimates of the poverty rate elasticity are negative in sign. [That is, the estimates suggest that the minimum wage reduces poverty. –JS] Indeed, only one study by Neumark et al. (2005) suggests that minimum wages actually increase the overall poverty rate.
…
Second, if we take an “average of averages”of the poverty rate elasticities for the overall population across the seven studies that provide such an estimate … we obtain an average poverty rate elasticity of -0.07. [A 10 percent increase in the minimum wage reduces poverty by 0.7 percent. –JS] However, excluding Neumark et al. (2005), the “average of averages” of the poverty rate elasticities is -0.15.
…
…when I consider the set of nearly all available estimates of the effects of minimum wage on poverty, the weight of the evidence suggests that minimum wages tend to have a small to moderate sized impact in reducing poverty.
This is an important new paper and I am sure it will figure prominently in the 2014 debate over raising the federal minimum wage.
This post originally appeared on John Schmitt’s blog, No Apparent Motive. January 11, 2014


