Article
Recognizing Native American Frontline Workers

Article
In a recent article, Gabriel R. Sanchez, Robert Maxim, and Raymond Foxworth highlight how job figures for Native Americans as a group are not included in the monthly job reports published by the Bureau of Labor Statistics (BLS). This omission means that Native American workers are mostly absent from broader discussions of the United States’ economic recovery. The result, as Sanchez and his colleagues note, is “another form of erasure for a group that must continually contend with marginalization and exclusion in U.S. society.”
In our past work on frontline workers, we have contributed to this problem by not including data on Native Americans as a separate category. In this article, we take a first step toward addressing this exclusion, using the most recently available five years of data (2015–2019) from the American Community Survey to take a closer look at Native American workers in frontline industries. We follow Sanchez, Maxim, and Foxworth in using the term “Native American” to describe American Indians and Alaska Natives. In recognition of the fact that the majority of those who identify as Native American also identify as at least one other race, our analysis includes multiracial Native Americans as well as those who identify as Native American alone.
To define “frontline industries,” we adapt and expand upon the industry groupings in our previous work in the early months of the pandemic (see A Demographic Profile of Workers in Frontline Industries for more details). We also include three industry groupings that were not part of our earlier work: Education (K-12), Public Safety and Emergency Services, and Agriculture and Food Processing. These additions are meant to reflect the fact that workers in these industries have been considered essential since the pandemic began, and many have been consistently required to work in-person despite the risk to both their own health and the health of others in their household.
As Table 1 shows, about one-third of all Native American workers work in frontline industries, including nearly 10 percent in Health Care, 5.7 percent in Education, and 5.6 percent in Grocery, Convenience, and Drug Stores. Relative to their share of the workforce as a whole, Native American workers are slightly overrepresented in several frontline industries, most notably in Childcare and Family Services.
| All Industries | All Other (Non-Frontline) Industries | All Frontline Industries | Workers by Frontline Industry Category | |||||||||
|---|---|---|---|---|---|---|---|---|---|---|---|---|
| Grocery, Convenience, and Drug Stores | Public Transit | Trucking, Warehouse, and Postal Service | Building Cleaning and Waste Mgmnt | Health Care | Childcare and Family Services | Public Safety and Emergency Services | Education | Agriculture and Food Processing | ||||
| All Workers | ||||||||||||
| In thousands | 154,707 | 104,500 | 50,207 | 7,375 | 811 | 4,605 | 2,010 | 16,325 | 3,250 | 2,936 | 9,067 | 3,828 |
| Share of all workers | – | 67.5 | 32.5 | 4.8 | 0.5 | 3.0 | 1.3 | 10.6 | 2.1 | 1.9 | 5.9 | 2.5 |
| Women | 47.5 | 41.3 | 60.5 | 50.6 | 29.2 | 25.7 | 45.0 | 76.7 | 86.2 | 36.2 | 75.1 | 28.7 |
| Without a Bachelor’s degree | 65.3 | 65.8 | 64.2 | 84.4 | 84.2 | 84.5 | 89.8 | 58.9 | 64.0 | 62.2 | 32.9 | 82.2 |
| Without health insurance | 10.4 | 11.4 | 8.5 | 12.1 | 5.5 | 13.0 | 23.9 | 5.9 | 9.7 | 2.2 | 3.3 | 16.3 |
| Household income <200% poverty | 19.8 | 19.6 | 20.2 | 30.3 | 15.8 | 19.5 | 35.7 | 17.2 | 29.3 | 8.2 | 12.1 | 28.0 |
| Own their home | 65.4 | 64.9 | 66.5 | 59.3 | 68.4 | 63.7 | 54.2 | 66.7 | 60.3 | 76.3 | 76.9 | 62.3 |
| Use public transit to get to work | 5.0 | 5.5 | 4.0 | 4.2 | 9.1 | 3.2 | 6.3 | 4.5 | 6.6 | 3.7 | 2.7 | 2.0 |
| Senior in household (age 65+) | 15.4 | 15.2 | 15.7 | 17.3 | 19.2 | 14.9 | 15.7 | 15.8 | 19.1 | 11.9 | 15.0 | 14.8 |
| Child in household (under age 18) | 41.2 | 40.2 | 43.2 | 41.5 | 38.9 | 40.4 | 46.2 | 42.9 | 44.6 | 45.1 | 44.7 | 44.5 |
| Native American | ||||||||||||
| Share of all workers | 1.5 | 1.4 | 1.5 | 1.7 | 1.5 | 1.4 | 1.7 | 1.4 | 1.9 | 1.6 | 1.4 | 1.7 |
| Share of Native American workers | – | 66.5 | 33.5 | 5.6 | 0.5 | 2.8 | 1.5 | 9.8 | 2.8 | 2.1 | 5.7 | 2.8 |
| Women | 49.0 | 43.0 | 61.0 | 55.2 | 36.7 | 29.3 | 43.6 | 78.2 | 84.3 | 39.7 | 72.5 | 27.7 |
| Without a Bachelor’s degree | 77.1 | 78.3 | 74.8 | 91.0 | 88.9 | 89.1 | 93.7 | 72.0 | 74.5 | 70.4 | 46.2 | 87.5 |
| Without health insurance | 17.6 | 18.7 | 15.4 | 21.1 | 10.3 | 18.2 | 28.0 | 12.5 | 16.3 | 7.2 | 8.6 | 25.1 |
| Household income <200% poverty | 28.8 | 28.6 | 29.4 | 40.4 | 22.2 | 22.7 | 40.2 | 27.2 | 37.5 | 15.1 | 20.6 | 37.7 |
| Own their home | 57.1 | 56.3 | 58.8 | 50.8 | 62.2 | 59.0 | 50.2 | 59.6 | 53.3 | 69.8 | 68.2 | 54.3 |
| Use public transit to get to work | 4.7 | 5.0 | 4.1 | 4.7 | 6.8 | 4.1 | 5.3 | 4.1 | 5.5 | 3.5 | 3.2 | 2.5 |
| Senior in household (age 65+) | 14.5 | 14.0 | 15.3 | 14.6 | 18.9 | 14.2 | 14.2 | 14.9 | 18.4 | 11.5 | 16.6 | 16.2 |
| Child in household (under age 18) | 45.1 | 43.9 | 47.4 | 46.4 | 41.1 | 42.4 | 46.3 | 48.1 | 49.7 | 50.5 | 48.1 | 47.4 |
| White | ||||||||||||
| Share of all workers | 62.8 | 63.9 | 60.7 | 59.2 | 53.7 | 54.9 | 46.9 | 60.5 | 55.2 | 66.9 | 70.7 | 56.5 |
| Share of white workers | – | 68.7 | 31.3 | 4.5 | 0.4 | 2.6 | 1.0 | 10.2 | 1.8 | 2.0 | 6.6 | 2.2 |
| Women | 47.2 | 40.9 | 61.1 | 51.5 | 25.7 | 25.5 | 38.5 | 77.3 | 86.9 | 32.7 | 75.8 | 26.1 |
| Without a Bachelor’s degree | 60.8 | 61.8 | 58.7 | 82.9 | 82.4 | 82.6 | 86.1 | 54.3 | 58.6 | 61.1 | 27.8 | 75.0 |
| Without health insurance | 6.9 | 7.5 | 5.5 | 9.0 | 4.3 | 9.5 | 15.4 | 3.9 | 7.1 | 1.6 | 2.2 | 8.9 |
| Household income <200% poverty | 14.6 | 14.6 | 14.8 | 25.8 | 11.5 | 14.5 | 26.0 | 12.4 | 23.4 | 6.6 | 8.8 | 17.3 |
| Own their home | 73.1 | 72.3 | 74.9 | 66.5 | 78.7 | 73.0 | 67.9 | 74.8 | 69.8 | 81.4 | 81.8 | 75.1 |
| Use public transit to get to work | 3.1 | 3.7 | 1.9 | 1.8 | 4.8 | 1.6 | 2.0 | 2.0 | 2.7 | 2.3 | 1.5 | 1.0 |
| Senior in household (age 65+) | 15.6 | 15.6 | 15.4 | 18.1 | 20.4 | 15.4 | 17.2 | 14.9 | 18.6 | 11.1 | 14.0 | 16.3 |
| Child in household (under age 18) | 37.0 | 35.9 | 39.4 | 36.0 | 35.2 | 34.6 | 37.4 | 39.3 | 41.0 | 44.2 | 43.7 | 35.9 |
Source and notes: CEPR analysis of American Community Survey, 2015-2019 5-Year Sample. Native American encompasses all persons who identified as American Indian or Alaskan Native, including those who also identified as other races, and regardless of Hispanic ethnicity. White includes those who identified solely as non-Hispanic white. Excludes non-civilians and non-employed.
Native American workers in frontline industries are much more likely than non-Hispanic, non-Native white frontline workers to live in low-income households and to lack health insurance.
Figure 1 compares the percentage of Native American and non-Native, non-Hispanic white frontline workers who live in low-income households, defined as households with money income below 200 percent of the official poverty line. Native American frontline workers are twice as likely as white frontline workers to live in low-income households. The disparity is largest among workers in Education and Public Safety and Emergency Services, although these two industry groups also have the lowest percentages of workers who live in low-income households. The percentage of Native American workers from low-income households is higher in frontline industries where Native American workers appear to be slightly overrepresented relative to their share of the workforce as a whole. Around 40 percent of Native American workers in Grocery, Convenience, and Drug Stores and Building Cleaning and Waste Management reside in low-income households.
Figure 1
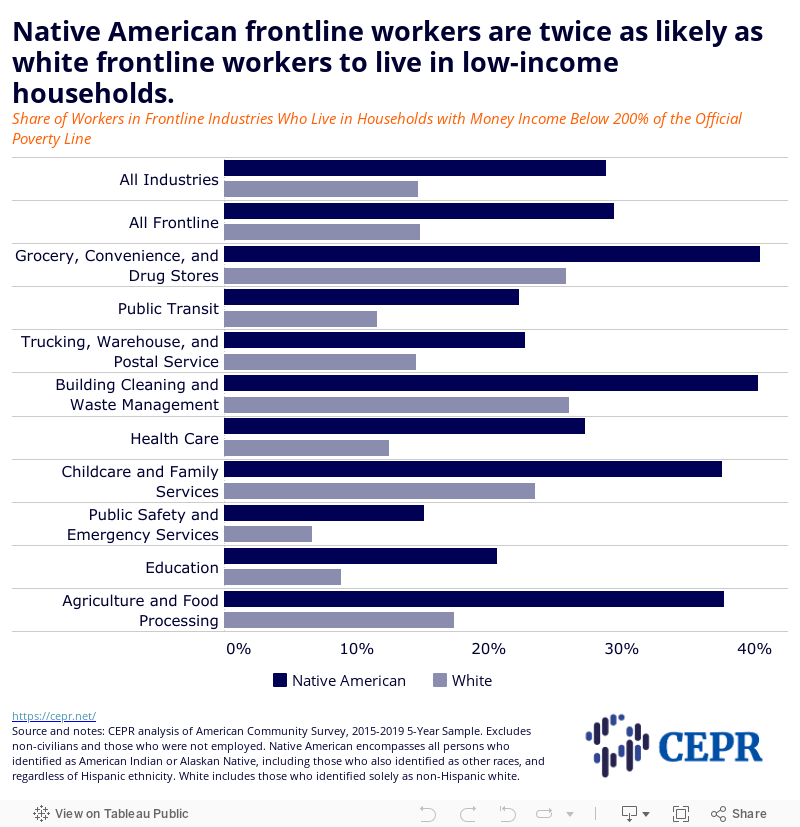
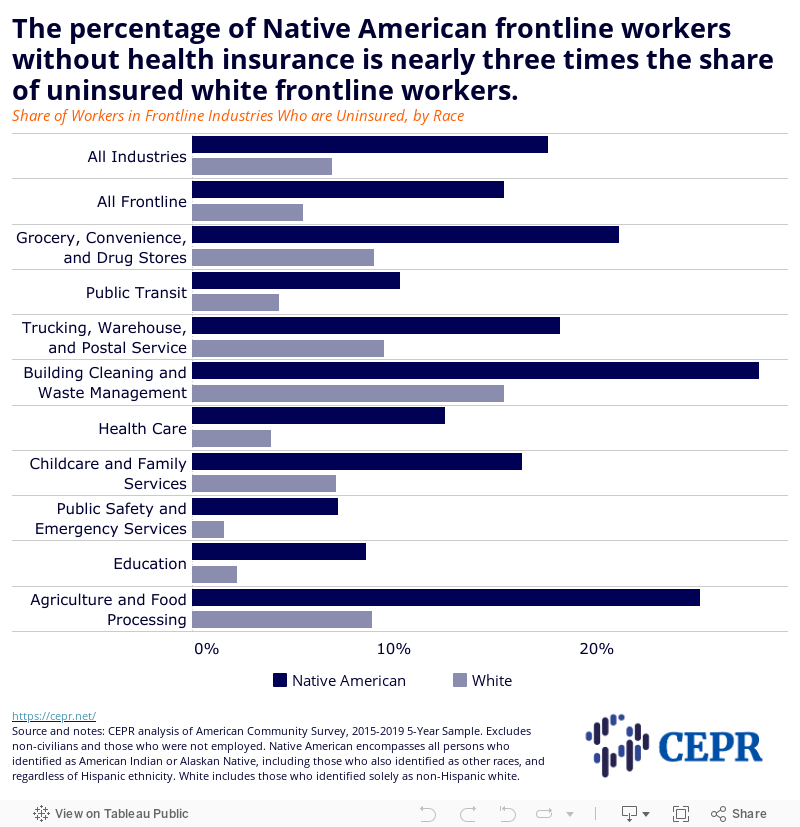
Figure 2 compares the percentage of Native American and white frontline workers who lack health insurance. As it shows, Native American workers in frontline industries are nearly three times as likely as white workers in these industries to be uninsured. The Native-white health insurance gap is especially large in Public Safety and Emergency Services, where the share of Native American workers who are uninsured is more than 4.5 times the share of white workers who are uninsured.
Figure 2
Many Native Americans, both insured and uninsured, are eligible for health care through the Indian Health Service (IHS). While the federal government has a legal obligation to provide health care to Native American communities, the services it administers through the IHS are sorely lacking. IHS services do not meet the coverage standards established under the Affordable Care Act, and the Census Bureau does not consider those for whom the IHS is the sole source of health care to be insured. Chronic underfunding and neglect of the IHS betrays the US government’s lack of good faith in meeting its treaty obligations. The fallout of these broken promises becomes especially visible during public health crises; the COVID-19 pandemic has been no exception. A CDC study from earlier in the pandemic found that the mortality rate for Native Americans was twice as high as it was for whites.
The disease-induced devastation of Native American communities by colonial forces is often framed as something that can be firmly relegated to this country’s past. Yet the legacy of violent displacement and dispossession continues to drive both economic and health disparities in Native American communities. The annual SPM poverty rate for Native Americans is almost twice as high as it is for non-Native, non-Hispanic whites, and poverty rates for Native American children and young people are even higher than for adults.
The outsize burden borne by Native Americans during the COVID-19 crisis is the result of centuries of oppression and neglect. Today, one of the drivers of this neglect is the paucity of data on Native American people. Native Americans may make up a small fraction of the US population, but they are also notoriously undercounted by the Census and other government surveys. Moreover, even when Native Americans are not wholesale excluded as a distinct pan-ethnic group, the lack of good data contributes to erasure by limiting opportunities for disaggregation. Native Americans are not a monolith; the US government recognizes over 500 different tribes, and countering the invisibility of Native Americans must include acknowledgment of the significant diversity among their ranks.
As Native American Heritage Month draws to a close and people around the United States celebrate another pandemic-era Thanksgiving, it is worth reflecting on the lack of visibility afforded to Native American people — including those who have worked on the frontlines of the crisis despite inadequate pay and health care. A just and inclusive recovery requires a commitment to visibility and equitable access to essential services, along with a level of investment in Native American communities that is commensurate with what they are legally owed.
The authors would like to thank Algernon Austin and Julie Cai for their valuable feedback.