New York Times columnist Peter Coy did a piece yesterday questioning the existence of a gap between productivity growth and the typical worker’s pay. This gap was established decades ago by my friends and former colleagues at the Economic Policy Institute (EPI). The fact that it is now being questioned says a lot about economics and even more about politics in this country.
First, let me be clear, my purpose is not to beat up on Coy. I’ve known him for many years and consider him a very good reporter/columnist who tries to get things right. The fact that he could be caught up in this mud-throwing effort speaks volumes about the influence of well-funded conservative think tanks and their ability to push their agenda even when it has no basis in reality.
The Productivity-Pay Gap, What Is at Issue?
When my former boss at EPI, Larry Mishel first began to write about the gap between productivity and pay, more than three decades ago, he was always very clear: the gap was between the productivity growth and the pay of the median or typical worker.
He and various colleagues at EPI, including Jared Bernstein, John Schmitt, Josh Bivens, Heidi Shierholtz, Sylvia Allegretto, and Elise Gould, were always pointing out that the gap was not between productivity and average pay, the source of the gap was within the wage distribution. In other words, money was going from workers at the middle and the bottom to workers at the top, like CEOs and Wall Street types, not from wages to profits.
For this reason, it was a bit jarring to read that there is little gap between productivity and average wages as some sort of revelation. We all knew this for several decades. (This is why some of us are less than convinced about the stories of excess monopoly power being the big issue in the economy. That would better fit a story of the money going to profits, not high-end workers.)
The other aspects of the ostensible controversy have long been dealt with by EPI and others. (I have written on the issue a couple of times over the years.) We typically use the Consumer Price Index to deflate wages while we use the GDP deflator to calculate productivity. The latter generally shows a lower rate of inflation than the former, which could explain some of the gap. To get around this issue, it’s necessary to use a common deflator, which I have done, as has EPI in its more recent analyses. It barely changes the story.
There is also an issue that an increasing share of compensation is going to non-wage benefits like employer-provided health care insurance. Actually, this was mostly a story in the 1980s and 1990s, not in this century. In any case, we deal with this by assuming that the median worker gets the same share of their compensation in non-wage benefits as the average worker.
Coy also raises the bizarre issue that EPI looks at growth in economy-wide productivity, rather than just the non-farm business sector. The issue, which was apparently raised by some of the conservative economists he consulted, is that this includes housing, which involves very little labor and therefore implicitly has high productivity.
It’s not clear what point they were attempting to make, but as a practical matter their argument goes the wrong way for their point. EPI is comparing the growth in productivity with the growth in real wages. The growth in economywide productivity has generally been slower than the growth of productivity in the non-farm business sector over the last half-century. Using this measure for productivity reduces the gap between productivity and wages.
In short, none of the issues raised by Coy is at all new. They have been well-known for decades and thoroughly addressed by EPI. The big issue is that they are now raised again in the country’s leading newspaper to muddy the waters around a long-established fact. It’s a bit like someone digging up old and long-refuted criticisms of Johannes Kepler’s theory of a sun-centered solar system.
Distracting from the Real Issue
As EPI and others have always contended, the question is why we had a quarter-century-long period of rapid growth (1947-1973), where the gains were broadly shared, to a period of slower growth where a disproportionate share of the gains went to high-end workers. Coy notes comments from the conservative economists that this just reflects the greater productivity of high-end workers.
But this misses the point. Productivity is determined by how we structure the economy. It is not an intrinsic feature of individual workers.
Starting with my favorite example, government-granted patent and copyright monopolies, and the fact that we have made them longer and stronger over the last half-century, have a huge impact on the “productivity” of the workers best situated to benefit from them. To take my poster child, how rich would Bill Gates be in a world where the government did not threaten to arrest anyone who copied Microsoft’s software without his permission? He would likely still be working for a living in that situation. (Okay, he might be collecting his Social Security now.)
There are millions of workers who collect much larger paychecks than would be the case if we had different rules on patents, copyrights, and other forms of intellectual property (IP). These rules are very much a policy choice, not an inherent feature of the economy. And just to connect the dots, higher prices for items like prescription drugs, medical equipment, software, computers, etc. mean lower real wages for everyone not benefitting from the IP rules.
A second way that we have structured the economy to redistribute income upward is to foster the growth of a bloated financial sector. In the mid-1970’s, the narrow financial sector (securities and commodities trading and investment banking) was about 0.4 percent of GDP. Today it is around 2.2 percent ($600 billion a year). Many of the country’s biggest fortunes are earned in the financial sector, and the major banks and private equity funds have plenty of people pocketing millions or tens of millions annually.
Here too the laws have an enormous impact. If we had financial transactions taxes, similar to the sales taxes most of us pay on food, clothes, and other items, we would have much less of our money going from our pockets to the Wall Street crew. Similarly, if we did not structure bankruptcy law to be so user-friendly, private equity companies would have much less fun taking over corporations and stripping their assets.
We also have structured our rules of corporate governance so that the CEOs and other top executives can rip off the companies they work for. One of the most striking items that got attention in the UAW strike last fall, was how much less money the top executives of the major car makers in Europe and Japan get paid than the CEOs of the Big Three here.
These are companies that are every bit as large and often more profitable than the Big Three. Yet their top executives get paid far less. In the extreme case, the CEO of Honda got less than one-tenth the pay of the CEO of GM.
This is due to a corrupt corporate governance structure where boards of directors see themselves as allies of top management, not agents of shareholders looking to rein in excessive compensation. The best story here is Elon Musk’s effort to get $55 billion out of Tesla, almost as much as the aid package for Ukraine.
According to advanced economic theory, more pay for top executives means less money for everyone else. And just to be clear, the excessive pay goes beyond the CEO. If the CEO gets $25 million, the other top execs likely get $10 million to $15 million, and the next tier can get paychecks in the single-digit millions.
Then we get the selective protectionism commonly known as “free trade.” This is selective protectionism because our trade policy has been structured to place manufacturing workers in direct competition with low-paid workers in the developing world. This has the predicted and actual effect of pushing down their wages, largely eliminating the manufacturing wage premium. Since manufacturing had historically been a source of good-paying jobs for workers without college degrees, this lowered the pay of less-educated workers more generally.
We could have applied free trade policies to professions that employed highly educated workers, like doctors and dentists. These professionals here earn two or three times as much as their counterparts in other wealthy countries. All the arguments for gains from trade would apply big-time to plans to make it easier for foreign-trained professionals to work here, but such proposals are nowhere on our policy agenda.
On the other side, full employment policies disproportionately benefit workers at the bottom end of the wage ladder. Many of us have long argued for these policies and we clearly see the impact with the strong economy of the last few years. Unions also make a huge difference in the pay of their members. And, if the minimum wage had kept pace with productivity growth, as it did between 1938 and 1968, it would be over $26 an hour today.
To be clear, when workers were getting the much higher minimum wage in 1968, relative to the economy’s average productivity, they must have been at least as productive as their pay, or they would not have been hired. (The unemployment rate was under 4.0 percent in 1968.) In short, productivity is far from some inherent characteristic of individual workers, it is the result of how we structure the economy.
Anyhow, this is a long detour from the debate over the productivity-pay gap, but it is where the discussion needs to take place. (Yes, this is the topic of my book Rigged [it’s free].) The right-wing economists challenging EPI’s analysis are just blowing smoke and trying to hide the real issues. We need to talk about how we have structured the economy to increase inequality within the wage distribution, and not pretend that this problem does not exist.
Read More Leer más Join the discussion Participa en la discusión
This is a bit nitpicky, but still a point worth making. If the unemployment rate came in below 4.0 percent in May, it would have been the 28th consecutive month of below 4.0 percent unemployment, beating the 27-month streak in the late 1960s boom. Unfortunately, the rate ticked up to 4.0 percent, so it seems that we just tied the 1960s streak.
However, if we go behind the rounding, the unemployment rate was actually 3.96 percent in May, still under 4.0 percent. This means that we did have 28 consecutive months of below 4.0 percent unemployment.
I’ll leave this one for the refs to determine, but I did want to get the numbers right.
Read More Leer más Join the discussion Participa en la discusión
It has been popular for people commenting on the state of the economy to say that consumers have to pull back on consumption because they have exhausted their savings. A big part of this story is that the saving rate is supposedly near a record low.
The reported saving rate, at 3.8 percent in the first quarter, is in fact very low, But treating this as a good measure of savings misunderstands the National Income and Product Accounts.
The first point to understand is how saving is measured. The saving rate does not measure money put into a savings account; it is simply a residual. The Commerce Department estimates disposable income, and then subtracts consumption. What is left is “savings.”
This definition is important to keep in mind if we are trying to get the story right. In recent quarters, we have had an unusually large and positive “statistical discrepancy” in the GDP accounts. The statistical discrepancy is the gap between GDP measured on the output side and the income side.
In principle, we can measure GDP by adding up the value of everything sold, whether as consumption items, investment, government purchases, or net exports. We can also measure GDP by adding up the income generated in the production process, wages, profits, interest, and rent.
We should get the same number either way, but in a $28 trillion economy the sums never come out exactly equal. In recent quarters the output side has been considerably larger than the income side. In the first quarter, the output side measure was 2.2 percent higher than the income side measure.
At this point, we don’t know which measure is closer to the true number, but for calculating the saving rate, it doesn’t matter. Either way, the saving rate has been substantially understated.
Suppose that the income side is correct, and output has been overstated by 2.2 percentage points. This means that the output components of GDP have been overstated, which means that consumption, which is more than 70 percent of GDP, has been overstated. If consumption has been overstated by 2.2 percent, then saving has been understated by roughly 2.2 percentage points. That would mean the true saving rate would be close to 6.0 percent.
Let’s assume the opposite; that the output side number is closer to the true number. In that case income is roughly 2.2 percent higher than currently reported. In that case, since consumption is unchanged, but disposable income is 2.2 percent higher, then the saving rate would again be roughly 2.2 percentage points higher, again putting it close to 6.0 percent.
The true number for GDP is likely somewhere in the middle, but the exact point doesn’t matter. The true saving rate is roughly 2.2 percentage points higher than the reported saving rate. That puts it equal to the 5.9 percent saving rate in the three years before the pandemic.
In short, when someone tells you that the saving rate is near a record low, they are telling you that they don’t understand the national accounts. They are not actually telling you about the saving rate.
Read More Leer más Join the discussion Participa en la discusión
The media are trying every way they can to push a bad economy story despite massive evidence that we are seeing the best economy in half a century. (No that doesn’t mean everyone is doing great, it means they are doing better on average than in the past.)
NYT columnist Peter Coy made his contribution to the effort with a column headlined “Why Can’t College Grads Find Jobs?” The piece then goes on to tell readers that unemployed recent grads are transitioning to employment at a somewhat lower rate than the average for the past two decades.
That sounds like bad news, but it requires a bit of reflection. The key measure in the Coy piece is the situation of “unemployed” college grads. This means that he is only looking at recent college graduates who reported being unable to find work in the prior month.
Many college graduates will not end up in this category. They may have a job arranged while they are still in college or perhaps moving into full-time employment at a job they had previously held part-time. In any case, if we want to assess the job prospects for recent college grads we need to look at all recent college grads, not just the relatively small fraction that reported being unemployed.
A recent analysis by Katherine DeCourcy and Elise Gould, at the Economic Policy Institute, looked at the situation of all recent college grads, not just the ones who reported being unemployed. This story looks markedly better than the situation reported in the Coy piece.
The unemployment rate and underemployment rate for recent grads (ages 21 to 24), had fallen below the pre-pandemic low, although the unemployment rate has creeped up slightly in recent months. There clearly is no story here of it being difficult for recent college grads to find jobs, unless we think it was also difficult for them to find jobs in 2019, just before the pandemic hit.
This column could have been more accurately reporting on how college grads can find jobs, but apparently that is not the line that most reporters or columnists are interested in promoting.
Read More Leer más Join the discussion Participa en la discusión
Yesterday the Washington Post ran an editorial that bothered me more than most Washington Post editorials. The headline said it all, “Telling Americans the economy is good won’t work.”
I knew I had heard this before but couldn’t remember where. Then it hit me, the Social Security debate of the 1990s.
The 1990s were the heyday of the Social Security “crisis.” The problem wasn’t that Social Security actually was in crisis. The problem was that all the pundits, very much including the news and editorial pages of the Washington Post, insisted that Social Security was in crisis.
This view was deeply entrenched in elite opinion. (Who can forget this classic?) It was endlessly repeated in wise columns by leading intellectuals and backed up with vaguely scary data, like the ratio of retirees to workers is rising (sort of like it always has).
The crisis story became so deeply entrenched that even progressive politicians, who knew it was tripe, felt they had to repeat it, otherwise they wouldn’t look serious. I recall having a Democratic pollster tell me that people just get angry if you don’t “acknowledge” that Social Security is in a crisis.
Being old-fashioned, I decided to stick with the facts rather than what the pollsters were telling me. My friend Mark Weisbrot and I wrote a book, Social Security: The Phony Crisis.
Anyhow, these memories all came back to me when I saw the Washington Post loudly asserting that we can’t tell people the economy is good. Well, I have been telling people the economy is good, based on the data, and I intend to continue to do so, despite the marching orders from the Washington Post.
The Good Economy Story
In making the case for the economy being good, my benchmark is 2019, before the pandemic, when most people said the economy was good. To be clear, even in 2019 tens of millions of people were struggling. The poverty rate was 10.5 percent, and if we go to double the poverty line, still a very low income, we’re talking about more than a quarter of the population.
So, saying 2019 was a good economy hardly means everyone was doing great, and it’s the same story today. We need to take steps to improve our system of social supports so that everyone can have decent housing, access to healthcare, and food. The Biden administration has made some steps in this direction, but we need to go much further.
But again, I’m using the 2019 benchmark. If 2019 was a good economy, then can we also say the economy is good today?
I will strongly argue that case, starting with what I have always considered the single most important statistic about the economy, the unemployment rate. The story of the unemployment rate is incredibly good. We have had 27 consecutive months of below 4.0 percent unemployment. That streak matches the run in the 1960s boom and exceeds any stretch in the last half century.
Unemployment is a really huge deal for the simple reason that in an economy where most people get the bulk of their income from working, not being able to get a job means you’re really screwed. But that is only the beginning of the story.
When the unemployment rate is low workers have more bargaining power. This means that workers can push for higher wages. They can tell their boss that they need a pay hike or they will go somewhere else. This is especially important for workers at the bottom end of the pay ladder and for people who are victims of discrimination in the labor market.
And we have seen this story play out in this recovery. Workers in the bottom decile of the pay distribution have seen the sharpest real wage gains in half a century. Overall Black and Black teen unemployment hit record lows, as did Hispanic unemployment. The Black/white wage gap is the lowest on record.
When we have a tight labor market workers quit bad jobs and find better ones. If a job has few opportunities for advancement, or the boss is a jerk, workers can go elsewhere. And they did in a big way in this recovery. As a result, their measure of job satisfaction is the highest on record.
This should all be a very big deal, but the pundits don’t want us to talk about low unemployment. It gets just passing mention in one sentence in the Post editorial.
The Inflation Horror Story
The Post editorial is about the inflation horror story, and that is bad news. Although even here, the pundits have to do some little twists to make their case. The problem is that the pandemic inflation has come down sharply in the last year. In fact, if we pull out one item, owners’ equivalent rent, the inflation rate was just 2.0 percent over the last year.
Am I playing games by pulling out a very important item? Well, owners’ equivalent rent is the rent that a homeowner would be paying to themselves, if they rented their own home. In other words, it is a payment that literally no one is making. I think it is fair to say that if this is what is driving the inflation story, there is not much of an inflation story.
But the pundits actually don’t want us to focus on current inflation. The problem, according to them, is that prices jumped during the pandemic and have not come back down.
There are two points to be made here. First, prices rose in the pandemic because of the pandemic. There was inflation everywhere in the world because of the pandemic. (Russia’s invasion of Ukraine also was a factor.)
We all get that people don’t care about inflation in Germany and France, they care about inflation here. But pandemic inflation is a reality, sort of like when a hurricane destroys much of the housing in an area you get a housing shortage. People may not care about the hurricane, they care about their housing, but that is the reality, as is the case with the pandemic and inflation.
Furthermore, for some reason people could understand pandemic unemployment and not blame Donald Trump. Have they gotten that much stupider in four years?
But the other reason the prices-going-back-down story is silly is that nominal wages have gone up by almost 22 percent since the start of the pandemic. We aren’t going to see pre-pandemic prices with post-pandemic wages, as all the pundits surely know.
To be clear, there has been some padding of profit margins since the pandemic, and we can reasonably hope that this will be reversed. But we’re talking about price declines here of 1.0-3.0 percent on average, not a story where prices fall back to their pre-pandemic levels.
Interestingly, no one expected prices to fall back to their pre-inflation surge levels in the 1980s. Everyone was satisfied that inflation had fallen back to a manageable pace of around 3.0-4.0 percent. However, this time around the pundits have chosen to place an obviously unrealistic complaint front and center in the policy debate.
We Are Not Telling Anyone They Should Feel Good About Their Own Situation
There is a final point here that is very important. No one is telling anyone that they personally are wrong about their own economic situation and that this is actually good, even though they think it is bad. The polls tell us that most people actually feel pretty good about their own economic situation. The problem is that people think their own situation is an exception and that everyone else is doing poorly.
So, in telling people that the economy is good, we are not saying that their perception of their own situation is wrong, we’re telling them that their perception of other people’s situation is mistaken. Now where would people get the idea that everyone else is doing horribly when they are doing good?
Anyhow, this is the place where the pundits don’t want us to go. Just like we couldn’t tell people that Social Security is not in a crisis, they don’t want us to tell them the economy is actually pretty good by most measures.
Everyone can make their own choices here, but I’m going to make the same choice I did a quarter century ago. I’m going to follow what the data say and not listen to what the pundits tell me. It’s a great economy!
Read More Leer más Join the discussion Participa en la discusión
Suppose the G-7 finance ministers sat down and worked out a plan to spend tens of billions of dollars a year to subsidize developing countries in their transition to a green economy. Many of us might think this is a good idea since global warming poses a real threat to the planet.
Unfortunately, the G-7 finance ministers seem to have done the exact opposite. They discussed ways to retaliate against China over its own plans to subsidize the transition to a green economy — according to coverage in the New York Times.
The article tells us:
“Policymakers worry that a flood of heavily subsidized Chinese green energy technology products will cripple the clean energy sectors in the United States and Europe, leading to lost jobs and reliance on China for solar panels, batteries, electric vehicles and other products.
….
’We need to stand together and send a unified message to China so they understand it’s not just one country that feels this way, but that they face a wall of opposition to the strategy that they’re pursuing,’ Ms. Yellen said at a news conference at the opening of the meetings.”
It is worth distinguishing two separate issues here. The G-7 countries do have sophisticated manufacturing sectors that are producing EVs, batteries, and other items needed for a green transition. It is understandable that they would want to provide some protection to these sectors so that they don’t become completely dependent on China. Also, in the near term, tens of thousands of jobs are potentially at stake.
However, this does not change the thrust of what China is doing. According to the allegation in the article, China is looking to massively subsidize its exports of green technology. Those who are concerned about global warming might see this as a good thing, sort of like if the G-7 countries were prepared to cough up the dough to help save the planet.
Rather than treating China as an outlaw country it might make sense to take advantage of China’s subsidized exports and direct them to countries where they would not be competing with domestic industries. That would accurately describe much of the developing world.
Countries in Africa, Latin America, and South Asia could benefit from low-cost electric vehicles (EVs) as well as solar panels, batteries, and other items needed for a transition to a green economy. This would not only have a large impact on reducing greenhouse emissions – it would also substantially reduce other pollutants in these countries, improving health and increasing life expectancy.
This would be a great win-win story, but of course that would only be true if we cared about the future of the planet, something apparently not on the agenda at the G-7 meeting.
Read More Leer más Join the discussion Participa en la discusión
The Washington Post has felt the need to continually emphasize the negative aspects of the economy under Biden. Remember all those great pieces on the fastest real wage growth in a half-century for the bottom quintile of workers, record rates of self-reported job satisfaction, the jump of 17 million people working from home, the 14 million homeowners saving thousands a year from having refinanced their mortgages 2020-22? And of course, they also remind readers regularly that the burst of inflation in the last three years was caused by the pandemic and happened in every wealthy country.
Yeah, that has not been the direction of economic coverage in the Post since President Biden took office. Instead, we get a focus on every piece of negative news and even efforts to turn positive news into negative news.
The latest was a front-page story that told us consumers were getting more negative on the economy. Among other items listed as bad news, the Post told us, “employers are adding fewer jobs.”
This comment presumably refers to the April jobs report which showed the economy added 175,000 jobs in the month. This is more than a bit bizarre to be included in the bad news category. There was widespread worry among economists that job growth had been faster than a rate that was sustainable without generating inflation, given the rate of growth of our labor market. The slowing to 175,000, a rate many still view as faster than sustainable, was viewed as great news by most economists.
While the Post apparently wants its readers to think this is a slow pace, it is almost exactly the average under Trump in the period before the pandemic.
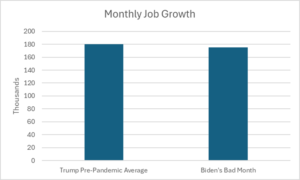
Source: Bureau of Labor Statistics and author’s calculation.
As can be seen, Biden’s “bad” month would be just about Trump’s average month. And we know the Post always tells us the economy was great under Trump.
There are other items that are beyond silly in this piece. It tells us some stores are seeing fewer customers, something that is pretty much true always. This also is good news because stores had inflated their profit margins during the pandemic. The only way to get them to reduce them is if they feel that higher prices are costing them customers.
The best part is that the Post found a woman who lost her job in the pandemic and is now working for lower pay:
“In Pittsburgh, Jenny Shimkus is thinking twice about every purchase these days. She has stopped eating out and frequently drives to other neighborhoods for cheaper gas. When her vacuum cleaner recently broke down, she spent three days trying to fix it, to no avail.
“’Five or 10 years ago, I would’ve said, “Forget it,” and just bought a new vacuum,’ she said. ‘But now I’ll try anything to save a few dollars.’
“Shimkus, a 40-year-old single mom, took a lower-paying job at a family-owned gyro shop after her lucrative bartending job disappeared during the pandemic. She made $38,000 last year — $18,000 less than she used to — and says she’s watched her hopes of homeownership slip away.”
Millions of people switch jobs every month. This was especially the case in late 2021 and 2022, as quit rates hit record levels. Most of these people found better jobs, but the Post chose to find someone who got a worse job. It is also worth noting that the rate of homeownership is above its pre-pandemic level, in spite of the drumbeat about it no longer being possible.
Anyhow, this is yet again an effort by a major media outlet to highlight and even invent negative news about the economy under Biden. This effort is likely a major part of the explanation for why people consistently view the national economy as being much worse than the economy in their state.
People have direct knowledge of the economy in their state or at least local community. They must rely on news outlets like the Washington Post (either directly or indirectly) to tell them about the national economy.
The Washington Post has felt the need to continually emphasize the negative aspects of the economy under Biden. Remember all those great pieces on the fastest real wage growth in a half-century for the bottom quintile of workers, record rates of self-reported job satisfaction, the jump of 17 million people working from home, the 14 million homeowners saving thousands a year from having refinanced their mortgages 2020-22? And of course, they also remind readers regularly that the burst of inflation in the last three years was caused by the pandemic and happened in every wealthy country.
Yeah, that has not been the direction of economic coverage in the Post since President Biden took office. Instead, we get a focus on every piece of negative news and even efforts to turn positive news into negative news.
The latest was a front-page story that told us consumers were getting more negative on the economy. Among other items listed as bad news, the Post told us, “employers are adding fewer jobs.”
This comment presumably refers to the April jobs report which showed the economy added 175,000 jobs in the month. This is more than a bit bizarre to be included in the bad news category. There was widespread worry among economists that job growth had been faster than a rate that was sustainable without generating inflation, given the rate of growth of our labor market. The slowing to 175,000, a rate many still view as faster than sustainable, was viewed as great news by most economists.
While the Post apparently wants its readers to think this is a slow pace, it is almost exactly the average under Trump in the period before the pandemic.
Source: Bureau of Labor Statistics and author’s calculation.
As can be seen, Biden’s “bad” month would be just about Trump’s average month. And we know the Post always tells us the economy was great under Trump.
There are other items that are beyond silly in this piece. It tells us some stores are seeing fewer customers, something that is pretty much true always. This also is good news because stores had inflated their profit margins during the pandemic. The only way to get them to reduce them is if they feel that higher prices are costing them customers.
The best part is that the Post found a woman who lost her job in the pandemic and is now working for lower pay:
“In Pittsburgh, Jenny Shimkus is thinking twice about every purchase these days. She has stopped eating out and frequently drives to other neighborhoods for cheaper gas. When her vacuum cleaner recently broke down, she spent three days trying to fix it, to no avail.
“’Five or 10 years ago, I would’ve said, “Forget it,” and just bought a new vacuum,’ she said. ‘But now I’ll try anything to save a few dollars.’
“Shimkus, a 40-year-old single mom, took a lower-paying job at a family-owned gyro shop after her lucrative bartending job disappeared during the pandemic. She made $38,000 last year — $18,000 less than she used to — and says she’s watched her hopes of homeownership slip away.”
Millions of people switch jobs every month. This was especially the case in late 2021 and 2022, as quit rates hit record levels. Most of these people found better jobs, but the Post chose to find someone who got a worse job. It is also worth noting that the rate of homeownership is above its pre-pandemic level, in spite of the drumbeat about it no longer being possible.
Anyhow, this is yet again an effort by a major media outlet to highlight and even invent negative news about the economy under Biden. This effort is likely a major part of the explanation for why people consistently view the national economy as being much worse than the economy in their state.
People have direct knowledge of the economy in their state or at least local community. They must rely on news outlets like the Washington Post (either directly or indirectly) to tell them about the national economy.
Read More Leer más Join the discussion Participa en la discusión
During the first year of the pandemic the one consistent position held by Donald Trump was that he did not want to be held responsible for anything. He basically told this to Bob Woodward in interviews for his book, but he also repeatedly made public comments to this effect over the course of 2020.
This started at the beginning of the pandemic’s spread to the country, when Trump said that he wanted to keep infected passengers on a cruise ship so that the number of people reported as having Covid in the United States would not rise. In the summer, Trump said that he ordered that testing be slowed down so that there would be fewer cases reported. Trump deferred to states in imposing pandemic restrictions in most areas, although he did himself impose a ban on international travel.
On vaccines, Trump funded the development of multiple vaccines through Operation Warp Speed. While he occasionally boasted about the success of the program (several other countries, including China, developed vaccines in a comparable timeframe), he made no plans for the vaccines’ distribution following approval. He also has chimed in with anti-vaxxers, threatening to punish school systems over decades-old mandates for vaccines against communicable diseases like measles and polio.
While Trump did often follow the advice of public health experts, he also at times pushed crackpot treatments like hydroxychloroquine. Trump also once famously suggested ingesting disinfectant internally and using ultraviolet light to kill the virus.
In short, Trump has no coherent position on the pandemic, he repeated reversed course on his policy. The only consistent theme to Trump’s positions was that he didn’t want to be held responsible for people getting sick and dying, but he also didn’t want to be held responsible for preventive measures that would limit the impact of the pandemic.
For this reason, when CNN tells readers:
“President Joe Biden and former President Donald Trump diverged over the Covid-19 pandemic,”
it is making up out of whole cloth the idea that Trump had a position in dealing with pandemic. There was and is no consistent position from Trump to contrast with Biden’s position, unless the contrast is supposed to be between a candidate trying to evade responsibility (Trump) and one that feels the government has a responsibility to protect public health.
Read More Leer más Join the discussion Participa en la discusión
There have been numerous pieces in major media outlets in recent days on the death of free trade which have been centered on the Biden administration’s use of tariffs to protect the U.S. market from Chinese EVs, solar batteries, and other products. These tariffs will raise the price of the protected items and cost American consumers more money, even though the figures being pushed by economists are often an exaggeration.[1]
There is also the problem that when the items being blocked by tariffs are necessary for a transition to a green economy, we are slowing the process and worsening global warming. Ideally, we would be collaborating with our trading partners, including China, on ways to make the worldwide transition to a green economy as quick as possible.
But apart from these points, there is an especially pernicious aspect to these discussions of tariffs and the contrast with “free trade.” While tariffs are undeniably protectionist measures, they are actually much smaller barriers to free trade than government-granted patent and copyright monopolies.
Tariffs are typically in a range of 15-25 percent of the product’s price. Even in the extreme cases being put on the table now, like the 100 percent tariff on Chinese EVs, we are only talking about doubling the price of the product. However, with patent and copyright monopolies we can be talking about increasing the price of the protected item by a factor of ten or even a hundred, the equivalent of 1000 percent or 10,000 percent tariffs.
This is most apparent in the case of prescription drugs. Drugs are almost always cheap to produce and distribute. It is patent monopolies that make them expensive. Drugs that would sell for $10 or $20 per prescription in a free market can sell for hundreds or even thousands of dollars per prescription when they are protected by patent monopolies.
This is a huge deal both from a health perspective since patent protection can make drugs that are necessary for people’s health and lives unaffordable, and also from an economic perspective. We will spend over $600 billion this year for drugs that would likely sell for less than $100 billion in a free market without patent monopolies or related protections. The gap of $500 billion is equivalent to roughly 2.2 percent of GDP. It is more than half the size of the military budget. It is almost nine times the size of the recent aid package for Ukraine. In short, it is real money.
Drugs are not the only area where patent monopolies and related protections are a big deal. Patents hugely raise the prices of medical equipment, pesticides and fertilizers, and computers and cellphones. Copyright monopolies can have an even larger effect on price. Expensive software could effectively be available at no cost if copyright monopolies did not prevent it from being freely transferred over the Internet. By my calculations, these forms of protectionism easily cost us more than $1 trillion a year in higher prices.
Patent and copyright monopolies do serve a purpose. They provide an incentive for innovation and creative work. Without the incentive they provide, we would have much less of both.
However, there are other ways to provide incentives, such as direct public funding or subsidies.[2] We already have such support through many channels, such the National Institutes of Health’s funding of biomedical research or the charitable contribution tax deduction, which can be used to support cultural work.
The relative merits of alternative mechanisms can be debated (see the discussion in chapter 5 of Rigged [it’s free]), but what cannot be debated is the fact that government-granted patent and copyright monopolies are forms of protectionism. Incredibly, in our public discussions, logic has been altogether turned on its head, with these protections being blessed as “free trade.”
People can speculate as to why this act of intellectual jujitsu has occurred, but I will point out that the beneficiaries of patent and copyright monopolies tend to have college or even advanced degrees. By contrast, most of the people who are likely to benefit from tariffs are workers without college degrees.
Anyhow, there are important policy issues at stake in the debate over imposing large tariffs on imports, especially those associated with a green transition. However, we should be clear, no one in this story ever favored free trade. There were just people who favored free trade where the beneficiaries of protection would be workers with less education than the people writing about the topic.
[1] When we buy more products from abroad we usually have to pay for them in some manner. In a standard general equilibrium model we would have to export other products to cover the cost of more imports. This would mean the dollar would fall in value relative to other currencies to make our exports more competitive. However, a lower-valued dollar would raise the price of other imports. Also, the price of the items we export would increase for U.S. consumers.
The real world is more complicated, and our trade does not have to be in balance. But many of the calculations pushed in news stories on the cost of protectionist barriers implicitly assume that foreign countries are effectively giving us these products for free.
[2] We have a great opportunity to test an alternative model with Corbevax, a vaccine against Covid. Corbevax is an open-source vaccine developed by Drs. Peter Hotez and Maria Elena Bottazzi, along with their colleagues at Baylor College of Medicine and Texas Children Hospital. As an open-source vaccine, the only cost in giving the shot is the manufacturing and distribution, which would likely come to less $5 a shot. By contrast, Moderna and Pfizer charge over $100 for their vaccines. (This is usually paid by insurers or the government, so most people would not see this tab.) While Corbevax has already been administered to over 100 million people in India and Indonesia, the Food and Drug Administration is blocking its use here. This is unfortunate. In addition to giving people an alternative to the mRNA vaccines, if Corbevax could be administered here it would provide clear evidence to the public that patent monopolies are not essential for developing new vaccines or drugs.
Read More Leer más Join the discussion Participa en la discusión
In the wake of the release of the 2024 Social Security Trustees Report, we have seen a wave of columns and news articles telling us that we won’t have enough workers to support a growing population of retirees. The story is that all of us baby boomer types are now retiring and the later generations are not having enough kids, so we will see a fall in the ratio of workers to retirees.
While the major media outlets love to push this line as a horror story, fans of arithmetic know it’s just ungodly silly. I’m tempted to turn this one over to ChatGPT, but I will write it myself again, this time.
The first point is that a falling ratio of workers to retirees is not exactly a new story. If we go to our friendly Social Security Trustees Report, we see that the ratio of workers to beneficiaries was 3.4 back in 2000 when all the baby boomers were still in the workforce. It is now down to 2.7. The ratio is projected to fall further to 2.2 by 2050.
I doubt that most people feel they have been terribly burdened by the falling ratio of workers to retirees in the last quarter century. But the media somehow seem to think it will be a disaster in the next quarter century.
Of course, the full picture would take the total dependency ratio, both the young and old, relative to the working-age population. That also is projected to rise somewhat, from 0.734 this year to 0.823 in 2050.
But this increase is also not a new story. We were at 0.669 in 2005. And we are never projected to come anywhere close to the 0.946 peak hit in 1965, when the baby boomers were all children.
Productivity Growth Allows for Rising Living Standards
But the bigger picture on demographics is the less important part of the story. The reality left out of these scare stories is that we are seeing rising productivity through time, which makes it possible for workers to support a larger population of retirees. The arithmetic on this is straightforward.
Suppose we want retirees to be able to get benefits equal to 70 percent of the average wage. Note this does not imply a sharp reduction in living standards of retirees relative to when they were working. A substantial share of the working-age population is supporting children. They also incur work-related expenses, like commuting, that retirees would not face.
With the current ratio of workers to retirees we would need a tax of roughly 20 percent on the wages of the working population to support this level of benefits. (This would actually only get us 67.5 percent of the average worker’s after-tax pay, but that’s close enough for this exercise.) It is also worth mentioning that the transfer of income from workers to retirees doesn’t have to be done through a tax on wages.
It is the same story if retirees get their income from the ownership of assets, like shares of stock or housing. The point is that people who are not working need to be supported by people who are. From an economic standpoint, it doesn’t matter if retirees get their income from Social Security paid by the government, dividends on shares of stock, or rent paid by tenants on the housing they own.
Suppose we left the taxing structure in place, so we are still pulling away 20 percent of workers’ wages to support the retired population in 2050. With the ratio of workers to retirees down to 2.2 at that point, each retiree will only be getting 55 percent of an average worker’s after-tax pay.
That may sound like retirees would be really screwed, until we factor in productivity growth. The Social Security trustees project that productivity growth will average just over 1.6 percent annually over the next quarter century. If this is fully passed on in higher real wages (long story here), that means wages will be more than 51 percent higher in 2050 than they are today. In this case, 55 percent of an average worker’s after-tax pay would be 23 percent more than today’s retirees are getting. Should we be crying for them?
The world is more complicated. Most people expect their living standards in retirement to be close to their living standards during their working lifetime. Suppose that we decide that we have to tax workers at a 25 percent rate in 2050 to bring the living standards of retirees closer to that of the working population. (This would get us to 73 percent of the average after-tax wage for retirees.)
We know the politics on this could be a problem, but if we’re supposed to be concerned about overburdening our young to pay for retirees, consider that a worker in 2050 paying a 25 percent tax on their pay would have a 42 percent higher after-tax wage than a worker today paying a 20 percent tax rate. It’s still hard to see the horror story.

Source: Social Security Trustees Report and author’s calculations.
Speeding Up Productivity Growth
Productivity growth is hugely important for living standards, but the reality is that we are very bad at figuring out ways to speed it up. In fact, we find it very hard to even know what the trend is.
The post-World War II productivity boom ended abruptly in 1973. No one saw it coming and the slowdown was not even fully recognized until years after the fact. Even now there is no consensus on its causes.
The 1995 productivity speedup caught most economists by surprise, although there is at least a general agreement that information technology was most of the story. When productivity growth slowed again in 2005, it caught most economists by surprise and again there is no agreed upon explanation for the slowing.
This means that we can’t just snap our fingers and order an acceleration of productivity growth. But we do know that trends do shift, and it is at least possible that growth could speed up (it also could slow).
We have seen very rapid productivity growth over the last year, with an increase of 2.9 percent. It is at least plausible that artificial intelligence and other new technologies could sustain a faster rate of productivity growth going forward.
Suppose that we see the growth rate increase by 0.5 percentage points above the 1.6 percent rate projected by the Trustees to 2.1 percent. This is still well below the rates of close to 3.0 percent that we saw in the post-war boom and the 1995-2005 speed up.
In that case, the average wage will be 72 percent higher in 2050 than it is today. And, if we leave the tax rate at 20 percent, the average retiree will have a benefit that is more than 40 percent higher than retirees get today, even assuming no increase in taxes. Where’s the horror story?

Source: Social Security Trustees Report and author’s calculations.
To be clear, there is no way we can guarantee this sort of sustained increase in productivity growth. Dealing with the effects of global warming will be a big factor in lowering growth, but it is at least a possible scenario. In any case, it is far more likely than getting a massive change in the willingness of people to have children over the next decade.
There is another dimension to this picture that is often overlooked. When we think of productivity growth our thoughts tend to focus narrowly on economic output, which is appropriate since it is a measure of output. However, the same sorts of technology that might let us produce more output in an hour of work, may also allow us to live healthier lives.
Our current image of a typical person in their 80s may be someone who is frail, and likely to need assistance in many activities of daily life. However, if we have improvements in nutrition and other aspects of health care, people in their 80s in the 2050s may be in far better health than is the case today. That would mean both they are likely to enjoy better lives and require less medical care.
Again, there are no guarantees here. There are many forces pushing the other way. Bad nutrition and drug and alcohol abuse, coupled with an incredibly wasteful healthcare system, could mean that we will see few gains in health status. But it is not absurd to think that gains are possible. In any case, that is not an issue that is in principle beyond our control.
In short, demographics will be a factor in determining standards of living in the decades ahead, but a relatively minor one. Furthermore, it is not one that we can really do very much about. The endless harping on demographics in the media is a distraction from policy changes that actually could improve people’s lives.
In the wake of the release of the 2024 Social Security Trustees Report, we have seen a wave of columns and news articles telling us that we won’t have enough workers to support a growing population of retirees. The story is that all of us baby boomer types are now retiring and the later generations are not having enough kids, so we will see a fall in the ratio of workers to retirees.
While the major media outlets love to push this line as a horror story, fans of arithmetic know it’s just ungodly silly. I’m tempted to turn this one over to ChatGPT, but I will write it myself again, this time.
The first point is that a falling ratio of workers to retirees is not exactly a new story. If we go to our friendly Social Security Trustees Report, we see that the ratio of workers to beneficiaries was 3.4 back in 2000 when all the baby boomers were still in the workforce. It is now down to 2.7. The ratio is projected to fall further to 2.2 by 2050.
I doubt that most people feel they have been terribly burdened by the falling ratio of workers to retirees in the last quarter century. But the media somehow seem to think it will be a disaster in the next quarter century.
Of course, the full picture would take the total dependency ratio, both the young and old, relative to the working-age population. That also is projected to rise somewhat, from 0.734 this year to 0.823 in 2050.
But this increase is also not a new story. We were at 0.669 in 2005. And we are never projected to come anywhere close to the 0.946 peak hit in 1965, when the baby boomers were all children.
Productivity Growth Allows for Rising Living Standards
But the bigger picture on demographics is the less important part of the story. The reality left out of these scare stories is that we are seeing rising productivity through time, which makes it possible for workers to support a larger population of retirees. The arithmetic on this is straightforward.
Suppose we want retirees to be able to get benefits equal to 70 percent of the average wage. Note this does not imply a sharp reduction in living standards of retirees relative to when they were working. A substantial share of the working-age population is supporting children. They also incur work-related expenses, like commuting, that retirees would not face.
With the current ratio of workers to retirees we would need a tax of roughly 20 percent on the wages of the working population to support this level of benefits. (This would actually only get us 67.5 percent of the average worker’s after-tax pay, but that’s close enough for this exercise.) It is also worth mentioning that the transfer of income from workers to retirees doesn’t have to be done through a tax on wages.
It is the same story if retirees get their income from the ownership of assets, like shares of stock or housing. The point is that people who are not working need to be supported by people who are. From an economic standpoint, it doesn’t matter if retirees get their income from Social Security paid by the government, dividends on shares of stock, or rent paid by tenants on the housing they own.
Suppose we left the taxing structure in place, so we are still pulling away 20 percent of workers’ wages to support the retired population in 2050. With the ratio of workers to retirees down to 2.2 at that point, each retiree will only be getting 55 percent of an average worker’s after-tax pay.
That may sound like retirees would be really screwed, until we factor in productivity growth. The Social Security trustees project that productivity growth will average just over 1.6 percent annually over the next quarter century. If this is fully passed on in higher real wages (long story here), that means wages will be more than 51 percent higher in 2050 than they are today. In this case, 55 percent of an average worker’s after-tax pay would be 23 percent more than today’s retirees are getting. Should we be crying for them?
The world is more complicated. Most people expect their living standards in retirement to be close to their living standards during their working lifetime. Suppose that we decide that we have to tax workers at a 25 percent rate in 2050 to bring the living standards of retirees closer to that of the working population. (This would get us to 73 percent of the average after-tax wage for retirees.)
We know the politics on this could be a problem, but if we’re supposed to be concerned about overburdening our young to pay for retirees, consider that a worker in 2050 paying a 25 percent tax on their pay would have a 42 percent higher after-tax wage than a worker today paying a 20 percent tax rate. It’s still hard to see the horror story.
Source: Social Security Trustees Report and author’s calculations.
Speeding Up Productivity Growth
Productivity growth is hugely important for living standards, but the reality is that we are very bad at figuring out ways to speed it up. In fact, we find it very hard to even know what the trend is.
The post-World War II productivity boom ended abruptly in 1973. No one saw it coming and the slowdown was not even fully recognized until years after the fact. Even now there is no consensus on its causes.
The 1995 productivity speedup caught most economists by surprise, although there is at least a general agreement that information technology was most of the story. When productivity growth slowed again in 2005, it caught most economists by surprise and again there is no agreed upon explanation for the slowing.
This means that we can’t just snap our fingers and order an acceleration of productivity growth. But we do know that trends do shift, and it is at least possible that growth could speed up (it also could slow).
We have seen very rapid productivity growth over the last year, with an increase of 2.9 percent. It is at least plausible that artificial intelligence and other new technologies could sustain a faster rate of productivity growth going forward.
Suppose that we see the growth rate increase by 0.5 percentage points above the 1.6 percent rate projected by the Trustees to 2.1 percent. This is still well below the rates of close to 3.0 percent that we saw in the post-war boom and the 1995-2005 speed up.
In that case, the average wage will be 72 percent higher in 2050 than it is today. And, if we leave the tax rate at 20 percent, the average retiree will have a benefit that is more than 40 percent higher than retirees get today, even assuming no increase in taxes. Where’s the horror story?
Source: Social Security Trustees Report and author’s calculations.
To be clear, there is no way we can guarantee this sort of sustained increase in productivity growth. Dealing with the effects of global warming will be a big factor in lowering growth, but it is at least a possible scenario. In any case, it is far more likely than getting a massive change in the willingness of people to have children over the next decade.
There is another dimension to this picture that is often overlooked. When we think of productivity growth our thoughts tend to focus narrowly on economic output, which is appropriate since it is a measure of output. However, the same sorts of technology that might let us produce more output in an hour of work, may also allow us to live healthier lives.
Our current image of a typical person in their 80s may be someone who is frail, and likely to need assistance in many activities of daily life. However, if we have improvements in nutrition and other aspects of health care, people in their 80s in the 2050s may be in far better health than is the case today. That would mean both they are likely to enjoy better lives and require less medical care.
Again, there are no guarantees here. There are many forces pushing the other way. Bad nutrition and drug and alcohol abuse, coupled with an incredibly wasteful healthcare system, could mean that we will see few gains in health status. But it is not absurd to think that gains are possible. In any case, that is not an issue that is in principle beyond our control.
In short, demographics will be a factor in determining standards of living in the decades ahead, but a relatively minor one. Furthermore, it is not one that we can really do very much about. The endless harping on demographics in the media is a distraction from policy changes that actually could improve people’s lives.
Read More Leer más Join the discussion Participa en la discusión