In the wake of the release of the 2024 Social Security Trustees Report, we have seen a wave of columns and news articles telling us that we won’t have enough workers to support a growing population of retirees. The story is that all of us baby boomer types are now retiring and the later generations are not having enough kids, so we will see a fall in the ratio of workers to retirees.
While the major media outlets love to push this line as a horror story, fans of arithmetic know it’s just ungodly silly. I’m tempted to turn this one over to ChatGPT, but I will write it myself again, this time.
The first point is that a falling ratio of workers to retirees is not exactly a new story. If we go to our friendly Social Security Trustees Report, we see that the ratio of workers to beneficiaries was 3.4 back in 2000 when all the baby boomers were still in the workforce. It is now down to 2.7. The ratio is projected to fall further to 2.2 by 2050.
I doubt that most people feel they have been terribly burdened by the falling ratio of workers to retirees in the last quarter century. But the media somehow seem to think it will be a disaster in the next quarter century.
Of course, the full picture would take the total dependency ratio, both the young and old, relative to the working-age population. That also is projected to rise somewhat, from 0.734 this year to 0.823 in 2050.
But this increase is also not a new story. We were at 0.669 in 2005. And we are never projected to come anywhere close to the 0.946 peak hit in 1965, when the baby boomers were all children.
Productivity Growth Allows for Rising Living Standards
But the bigger picture on demographics is the less important part of the story. The reality left out of these scare stories is that we are seeing rising productivity through time, which makes it possible for workers to support a larger population of retirees. The arithmetic on this is straightforward.
Suppose we want retirees to be able to get benefits equal to 70 percent of the average wage. Note this does not imply a sharp reduction in living standards of retirees relative to when they were working. A substantial share of the working-age population is supporting children. They also incur work-related expenses, like commuting, that retirees would not face.
With the current ratio of workers to retirees we would need a tax of roughly 20 percent on the wages of the working population to support this level of benefits. (This would actually only get us 67.5 percent of the average worker’s after-tax pay, but that’s close enough for this exercise.) It is also worth mentioning that the transfer of income from workers to retirees doesn’t have to be done through a tax on wages.
It is the same story if retirees get their income from the ownership of assets, like shares of stock or housing. The point is that people who are not working need to be supported by people who are. From an economic standpoint, it doesn’t matter if retirees get their income from Social Security paid by the government, dividends on shares of stock, or rent paid by tenants on the housing they own.
Suppose we left the taxing structure in place, so we are still pulling away 20 percent of workers’ wages to support the retired population in 2050. With the ratio of workers to retirees down to 2.2 at that point, each retiree will only be getting 55 percent of an average worker’s after-tax pay.
That may sound like retirees would be really screwed, until we factor in productivity growth. The Social Security trustees project that productivity growth will average just over 1.6 percent annually over the next quarter century. If this is fully passed on in higher real wages (long story here), that means wages will be more than 51 percent higher in 2050 than they are today. In this case, 55 percent of an average worker’s after-tax pay would be 23 percent more than today’s retirees are getting. Should we be crying for them?
The world is more complicated. Most people expect their living standards in retirement to be close to their living standards during their working lifetime. Suppose that we decide that we have to tax workers at a 25 percent rate in 2050 to bring the living standards of retirees closer to that of the working population. (This would get us to 73 percent of the average after-tax wage for retirees.)
We know the politics on this could be a problem, but if we’re supposed to be concerned about overburdening our young to pay for retirees, consider that a worker in 2050 paying a 25 percent tax on their pay would have a 42 percent higher after-tax wage than a worker today paying a 20 percent tax rate. It’s still hard to see the horror story.

Source: Social Security Trustees Report and author’s calculations.
Speeding Up Productivity Growth
Productivity growth is hugely important for living standards, but the reality is that we are very bad at figuring out ways to speed it up. In fact, we find it very hard to even know what the trend is.
The post-World War II productivity boom ended abruptly in 1973. No one saw it coming and the slowdown was not even fully recognized until years after the fact. Even now there is no consensus on its causes.
The 1995 productivity speedup caught most economists by surprise, although there is at least a general agreement that information technology was most of the story. When productivity growth slowed again in 2005, it caught most economists by surprise and again there is no agreed upon explanation for the slowing.
This means that we can’t just snap our fingers and order an acceleration of productivity growth. But we do know that trends do shift, and it is at least possible that growth could speed up (it also could slow).
We have seen very rapid productivity growth over the last year, with an increase of 2.9 percent. It is at least plausible that artificial intelligence and other new technologies could sustain a faster rate of productivity growth going forward.
Suppose that we see the growth rate increase by 0.5 percentage points above the 1.6 percent rate projected by the Trustees to 2.1 percent. This is still well below the rates of close to 3.0 percent that we saw in the post-war boom and the 1995-2005 speed up.
In that case, the average wage will be 72 percent higher in 2050 than it is today. And, if we leave the tax rate at 20 percent, the average retiree will have a benefit that is more than 40 percent higher than retirees get today, even assuming no increase in taxes. Where’s the horror story?

Source: Social Security Trustees Report and author’s calculations.
To be clear, there is no way we can guarantee this sort of sustained increase in productivity growth. Dealing with the effects of global warming will be a big factor in lowering growth, but it is at least a possible scenario. In any case, it is far more likely than getting a massive change in the willingness of people to have children over the next decade.
There is another dimension to this picture that is often overlooked. When we think of productivity growth our thoughts tend to focus narrowly on economic output, which is appropriate since it is a measure of output. However, the same sorts of technology that might let us produce more output in an hour of work, may also allow us to live healthier lives.
Our current image of a typical person in their 80s may be someone who is frail, and likely to need assistance in many activities of daily life. However, if we have improvements in nutrition and other aspects of health care, people in their 80s in the 2050s may be in far better health than is the case today. That would mean both they are likely to enjoy better lives and require less medical care.
Again, there are no guarantees here. There are many forces pushing the other way. Bad nutrition and drug and alcohol abuse, coupled with an incredibly wasteful healthcare system, could mean that we will see few gains in health status. But it is not absurd to think that gains are possible. In any case, that is not an issue that is in principle beyond our control.
In short, demographics will be a factor in determining standards of living in the decades ahead, but a relatively minor one. Furthermore, it is not one that we can really do very much about. The endless harping on demographics in the media is a distraction from policy changes that actually could improve people’s lives.
In the wake of the release of the 2024 Social Security Trustees Report, we have seen a wave of columns and news articles telling us that we won’t have enough workers to support a growing population of retirees. The story is that all of us baby boomer types are now retiring and the later generations are not having enough kids, so we will see a fall in the ratio of workers to retirees.
While the major media outlets love to push this line as a horror story, fans of arithmetic know it’s just ungodly silly. I’m tempted to turn this one over to ChatGPT, but I will write it myself again, this time.
The first point is that a falling ratio of workers to retirees is not exactly a new story. If we go to our friendly Social Security Trustees Report, we see that the ratio of workers to beneficiaries was 3.4 back in 2000 when all the baby boomers were still in the workforce. It is now down to 2.7. The ratio is projected to fall further to 2.2 by 2050.
I doubt that most people feel they have been terribly burdened by the falling ratio of workers to retirees in the last quarter century. But the media somehow seem to think it will be a disaster in the next quarter century.
Of course, the full picture would take the total dependency ratio, both the young and old, relative to the working-age population. That also is projected to rise somewhat, from 0.734 this year to 0.823 in 2050.
But this increase is also not a new story. We were at 0.669 in 2005. And we are never projected to come anywhere close to the 0.946 peak hit in 1965, when the baby boomers were all children.
Productivity Growth Allows for Rising Living Standards
But the bigger picture on demographics is the less important part of the story. The reality left out of these scare stories is that we are seeing rising productivity through time, which makes it possible for workers to support a larger population of retirees. The arithmetic on this is straightforward.
Suppose we want retirees to be able to get benefits equal to 70 percent of the average wage. Note this does not imply a sharp reduction in living standards of retirees relative to when they were working. A substantial share of the working-age population is supporting children. They also incur work-related expenses, like commuting, that retirees would not face.
With the current ratio of workers to retirees we would need a tax of roughly 20 percent on the wages of the working population to support this level of benefits. (This would actually only get us 67.5 percent of the average worker’s after-tax pay, but that’s close enough for this exercise.) It is also worth mentioning that the transfer of income from workers to retirees doesn’t have to be done through a tax on wages.
It is the same story if retirees get their income from the ownership of assets, like shares of stock or housing. The point is that people who are not working need to be supported by people who are. From an economic standpoint, it doesn’t matter if retirees get their income from Social Security paid by the government, dividends on shares of stock, or rent paid by tenants on the housing they own.
Suppose we left the taxing structure in place, so we are still pulling away 20 percent of workers’ wages to support the retired population in 2050. With the ratio of workers to retirees down to 2.2 at that point, each retiree will only be getting 55 percent of an average worker’s after-tax pay.
That may sound like retirees would be really screwed, until we factor in productivity growth. The Social Security trustees project that productivity growth will average just over 1.6 percent annually over the next quarter century. If this is fully passed on in higher real wages (long story here), that means wages will be more than 51 percent higher in 2050 than they are today. In this case, 55 percent of an average worker’s after-tax pay would be 23 percent more than today’s retirees are getting. Should we be crying for them?
The world is more complicated. Most people expect their living standards in retirement to be close to their living standards during their working lifetime. Suppose that we decide that we have to tax workers at a 25 percent rate in 2050 to bring the living standards of retirees closer to that of the working population. (This would get us to 73 percent of the average after-tax wage for retirees.)
We know the politics on this could be a problem, but if we’re supposed to be concerned about overburdening our young to pay for retirees, consider that a worker in 2050 paying a 25 percent tax on their pay would have a 42 percent higher after-tax wage than a worker today paying a 20 percent tax rate. It’s still hard to see the horror story.
Source: Social Security Trustees Report and author’s calculations.
Speeding Up Productivity Growth
Productivity growth is hugely important for living standards, but the reality is that we are very bad at figuring out ways to speed it up. In fact, we find it very hard to even know what the trend is.
The post-World War II productivity boom ended abruptly in 1973. No one saw it coming and the slowdown was not even fully recognized until years after the fact. Even now there is no consensus on its causes.
The 1995 productivity speedup caught most economists by surprise, although there is at least a general agreement that information technology was most of the story. When productivity growth slowed again in 2005, it caught most economists by surprise and again there is no agreed upon explanation for the slowing.
This means that we can’t just snap our fingers and order an acceleration of productivity growth. But we do know that trends do shift, and it is at least possible that growth could speed up (it also could slow).
We have seen very rapid productivity growth over the last year, with an increase of 2.9 percent. It is at least plausible that artificial intelligence and other new technologies could sustain a faster rate of productivity growth going forward.
Suppose that we see the growth rate increase by 0.5 percentage points above the 1.6 percent rate projected by the Trustees to 2.1 percent. This is still well below the rates of close to 3.0 percent that we saw in the post-war boom and the 1995-2005 speed up.
In that case, the average wage will be 72 percent higher in 2050 than it is today. And, if we leave the tax rate at 20 percent, the average retiree will have a benefit that is more than 40 percent higher than retirees get today, even assuming no increase in taxes. Where’s the horror story?
Source: Social Security Trustees Report and author’s calculations.
To be clear, there is no way we can guarantee this sort of sustained increase in productivity growth. Dealing with the effects of global warming will be a big factor in lowering growth, but it is at least a possible scenario. In any case, it is far more likely than getting a massive change in the willingness of people to have children over the next decade.
There is another dimension to this picture that is often overlooked. When we think of productivity growth our thoughts tend to focus narrowly on economic output, which is appropriate since it is a measure of output. However, the same sorts of technology that might let us produce more output in an hour of work, may also allow us to live healthier lives.
Our current image of a typical person in their 80s may be someone who is frail, and likely to need assistance in many activities of daily life. However, if we have improvements in nutrition and other aspects of health care, people in their 80s in the 2050s may be in far better health than is the case today. That would mean both they are likely to enjoy better lives and require less medical care.
Again, there are no guarantees here. There are many forces pushing the other way. Bad nutrition and drug and alcohol abuse, coupled with an incredibly wasteful healthcare system, could mean that we will see few gains in health status. But it is not absurd to think that gains are possible. In any case, that is not an issue that is in principle beyond our control.
In short, demographics will be a factor in determining standards of living in the decades ahead, but a relatively minor one. Furthermore, it is not one that we can really do very much about. The endless harping on demographics in the media is a distraction from policy changes that actually could improve people’s lives.
Read More Leer más Join the discussion Participa en la discusión
I ask because it ran that piece today and one of the major factoids cited was that wealth for the bottom half of the population is below its level before the Fed began raising interest rates. This is true, wealth for the bottom half of the population is below its level in the fourth quarter of 2022.
But wealth for the bottom half of the population grew substantially in 2020 and 2021, due to the pandemic payments from the government, and the fact that consumption spending on many items was limited by the pandemic. The drop highlighted in this piece, from $3.74 trillion in the fourth quarter of 2022 to $3.66 trillion (both adjusted for inflation) in the fourth quarter of last year is trivial compared to the rise from the last quarter before the pandemic.
In the fourth quarter of 2019, the Fed put wealth for the bottom half of the population at just $1.95 trillion. This means that the wealth of the bottom half of the population in the most recent data is nearly 90 percent higher, adjusted for inflation, than it was just before the pandemic.
This raises the question as to why the NYT would run a major piece, by two of its top economic reporters (both of whom are very good reporters), telling us that low- and moderate-income people are suffering now? After all, if they are suffering today, surely they were suffering much more just before the pandemic when their wealth was far lower.
This point also holds true if we look at homeownership, which the piece tells us is getting increasingly difficult for moderate-income families. The homeownership rate for families below the median income stood at 52.5 percent in the first quarter of 2024, up from 51.4 percent in the fourth quarter of 2019.
I have long argued that wealth is a less important measure than income, especially when it comes to the poor since they never have very much. To my view, it is far more important that we have good social welfare programs that ensure access to healthcare, decent housing, good schools, and retirement income.
On that score, things look reasonably good. The Biden administration’s expansion of subsidies in the Affordable Care Act has helped extend health insurance coverage. And Biden’s income-driven student debt repayment plan, coupled with tens of billions of dollars of debt forgiveness, have eased the burden on tens of millions of low-and moderate-income debtors.
If we look at income for low-and moderate-income families, it is likely a pretty good picture right now. We have just tied the 27-month streak of below 4.0 percent unemployment that we saw in the 1960s boom. As the NYT piece notes, low unemployment is especially important for low-income households, since these are the people who disproportionately lose their jobs when the unemployment rate rises.
Also, we have seen an extraordinary rise in the real wages of workers at the bottom of the wage distribution. The tight labor market in the recovery has given these workers far more bargaining power. They have taken advantage of this situation to demand higher pay or to move to jobs that will give them higher pay.
There are two points to be made here. First, in the United States we always have tens of millions of families who are struggling to be get by, or in many cases not getting by. This is a horrible situation which should be a major focus of national policy. The current situation is not different in that respect.
The second is that by most measures, the bottom half of the population looks to be doing better now than at most points in the last half-century. This raises the question of why the NYT felt the need to tell us that they are doing poorly today?
There is no doubt that high interest rates hurt many of these families who need to borrow, but that does not change the overall picture that things look relatively good for this group. So why are we constantly hearing about the negative and not about the tens of millions of people who have moved into higher paying jobs, or previously unemployed people who were able to find jobs in a strong labor market? Surely the NYT could assign some reporters to that beat.
Read More Leer más Join the discussion Participa en la discusión
CNN endlessly runs stories on troubled consumers that are completely at odds with government data. While its sources may have useful stories to tell, the government statistical agencies construct their data based on surveys of tens of thousands of individuals and businesses. The government data likely does a better job of describing economic reality.
In this vein, CNN ran a piece last week on how consumers could no longer afford to eat at restaurants or even fast food restaurants.
“For a while, restaurant customers were trading down — swapping out expensive meals for cheaper ones, but still dining out. Now, some are responding to higher menu prices by trading out entirely: Instead of opting for cheaper restaurants or meals, they’re eating more at home and spending less when they do go out.
“That means that restaurants have to battle it out for these cost-conscious consumers. And now, it’s not just burger chain against burger chain.
“Because fast food joints have been hiking up prices in recent years, dine-in spots like Applebee’s can run promotions that end up costing about the same as a fast food lunch — giving them a chance to try to steal those customers away.”
This story of people no longer being able to afford restaurants is 180 degrees at odds with the data from the Bureau of Economic Analysis (BEA). According to data from the BEA (Line 236), real spending at restaurants was 11.0 percent higher in the first quarter of this year than in the fourth quarter of 2019, the last quarter before the pandemic hit. Real spending at fast food restaurants (Line 242) increased even more rapidly, rising by 11.8 percent.
Contrary to the story CNN is pushing — of cash-strapped families being unable to afford restaurant meals — the government data shows a picture of rapid growth, despite the impact of the worldwide pandemic. Just to be clear, this is spending after adjusting for the impact of higher prices, so people actually are buying more meals at restaurants than they did before the pandemic.
Read More Leer más Join the discussion Participa en la discusión
For the last quarter century, those of us hoping we could slow global warming were anxious to see a quick conversion to electric vehicles (EVs). If we could get most people using electric vehicles, and have the energy coming from clean sources, we could radically reduce greenhouse gas emissions.
The problem was that EVs were considerably more expensive than their conventional counterparts. There were savings in operation due to lower maintenance, and the electricity generally costing less than gas, but that usually was not enough to offset the higher purchase price.
This was the motivation for the tax credit that the Biden administration included in the 2022 Inflation Reduction Act. The idea was to bring the price of EVs closer to the price of conventional cars.
After worrying for decades that the price of EVs was too high, we now have a different problem, the price is too low. China is now producing over ten million electric cars a year, some carrying price tags of under $10k. This has prompted terror here, with politicians tripping over themselves to find ways to keep people from buying them.
The concern is that it will wipe out the domestic U.S. auto industry. After telling us for decades that Americans don’t want to buy electric cars, people like Donald Trump are yelling about how we have to take strong measures, like 100 percent tariffs, to prevent them from buying electric cars.
This would be great comedy, except that it is a huge issue, and no one apparently cares that politicians are inconsistent. But those of us who are not running for office have the ability to talk about the issue seriously.
First, if China wants to export cheap EVs to the world, we should see that as a good thing, not an act of war. The flat-earth society may not believe in global warming, but the rest of us don’t have that luxury. Tens of millions of low-cost EVs being sold around the world in the next few years would hugely help advance the effort to slow emissions. If China wants to subsidize this process, we should be thanking them.
At the same time, it does make sense for us to protect our domestic industry. We do have a genuine national security interest in not being dependent on China for our cars.
We can do this by stealing a page from Ronald Reagan. In the 1980s the U.S. auto industry’s survival was seriously threatened by a flood of imports from Japan. Reagan responded by getting Japan to agree to voluntarily export restraints on the number of cars they sold in the United States.
Under this system, the major Japanese manufacturers were each allowed to export a certain number of cars each year to the United States. These restrictions gave the U.S. industry breathing space to adjust to changing conditions in the auto market and adopt more efficient manufacturing techniques. It also encouraged Japanese manufacturers to establish operations in the United States, where they now directly and indirectly support hundreds of thousands of jobs.
We could adopt a similar approach with China. Obviously, there would be serious haggling over how many EVs the Chinese manufacturers could sell here, but at the end of the day we should be able to agree on a number.
Since China will have capacity to export more EVs than the United States and other wealthy countries are willing to import, we can work together with China to promote their export to developing countries that currently lack a domestic car industry.
In many poorer countries the EVs would be replacing older cars that spew large amounts of emissions. This would be great from the standpoint of slowing global warming, and also from the standpoint of improving the health of people in developing countries.
This would be a great way to work with China to further our common goal of slowing global warming. Politicians like to compete about who is tougher on China. That might be fun theater, but the entertainment is not worth our time.
We should instead want our politicians to compete over who can be smarter with China. Cooperating with China to rapidly replace conventional cars with EVs is smart. We should want our politicians to compete over that.
Read More Leer más Join the discussion Participa en la discusión
The New York Times reported that Jim Simons, the founder of Medallion hedge fund, died this week. As a result of his fund, according to the article, he accumulated more than $20 billion over his lifetime.
Simons was a math genius who had made many important breakthroughs in various areas of math. Back in the 1980s, he decided that he could make far more money on Wall Street than in doing math at a university. He thought that with sophisticated algorithms and cutting-edge computers, he could beat the market by finding patterns in trading.
This meant literally making trades seconds or even fractions of a second before other traders became aware of a price shift. If a trade could make a margin on even a few fractions of a percentage point on trades, hundreds of times, that can translate into big bucks.
According to the NYT, the Medallion fund averaged returns of 66 percent a year for several decades. This translates into some serious money.
It is worth reflecting on this one for a moment. There is an argument that a far-sighted person, looking at economic data, can provide information to the market and lead to desirable supply and demand adjustments through their speculation.
For example, if someone looked at oil supply trends, and decided that falling demand due to the explosion of electric vehicles meant lower future prices, they would be providing important information to the market by selling oil futures and depressing oil prices in the present. This would lead to less drilling and therefore fewer resources wasted developing a resource that would never be used. That would be good for the economy if this accurately described the reality.
However, beating the market by a few seconds provides zero useful information to the market. No one is going to change their investment decisions based on the price of oil or any other commodity rising or falling a fraction of a percent for a few seconds.
Mr. Simons’ wealth was pure rent. He was pulling money away from other actors in the market who would have earned more if Simons had not gotten there first. He wasn’t contributing to the economy. Since Simons and the other math whizzes he hired had skills that could have been put to productive uses in other fields, his fund was a net drain on the economy.
This is where a modest financial transactions tax (FTT), similar to the sales tax we pay when we buy clothes, food, and most other items, would have been enormously useful. If a stock trade was taxed at say a 0.1 percent rate, and we had comparable taxes on trades of bonds, options, and other derivatives, there would have been much less money for Mr. Simons to snap up with his sophisticated algorithms. He may have continued to do academic mathematics and the gains from his hedge fund would have gone to other investors.
Unfortunately, the Simons of this world are so politically powerful that it is difficult to even get FTTs discussed in the U.S. (Many other countries already have them, including the UK, which has a 0.5 percent tax on stock trades.) An FTT is a great way to raise lots of money for the government while reducing waste in the financial sector.
But as we know, that waste is income for a lot of rich and powerful people. That means, given the structure of American politics, it is not on the agenda.
Read More Leer más Join the discussion Participa en la discusión
Polls always show that many people, especially young people, don’t expect to see their Social Security benefits. I have been writing on this stuff long enough that many of the same young people who told me 30 years ago that they would never see their benefits, are now collecting Social Security.
The idea that Social Security is about to disappear is basically a flat earth-type lie. There is no economic reason that we can’t pay benefits into the indefinite future, as long as we don’t face some sort of economic collapse from something like nuclear war or a climate disaster.
As the program is now structured, it is projected to face a shortfall beginning in 2035. After that point, if the law is never changed, it can still pay over 80 percent of scheduled benefits.
To be clear, it would be a very bad story if retirees were forced to take a 20 percent cut in benefits. But 80 percent is far more than zero, so the idea that people will receive no benefits after 2035 would require that Congress actually take action to terminate the program. In an electorate that will have an even larger share of retirees than we have today, that seems pretty hard to imagine.
In fact, it is difficult to imagine elected representatives in 2035 even going along with a 20 percent cut in benefits. While there will undoubtedly be considerable political wrangling over the structure of the program going forward, it seems unlikely that the bulk of the shortfall will be made up on the benefit side. There could be some benefit cuts, but these would likely be relatively minor. Most people would continue to see the bulk of their scheduled benefits.
Given this reality, it was incredibly irresponsible of the New York Times to begin a major piece on retirement income by profiling a worker who says that they don’t expect to see their Social Security benefits. The piece begins:
“Jen Forbus turned 50 this year. She is in good health and says her life has only gotten better as she has grown older. Forbus resides in Lorain, Ohio, not far from Cleveland; she is single and has no children, but her parents and sisters are nearby. She works, remotely, as an editorial supervisor for an educational publishing company, a job that she loves. She is on track to pay off her mortgage in the next 10 years, and having recently made her last car payment, she is otherwise debt-free. By almost any measure, Forbus is middle class.”
It then tells us that she wants to retire at age 65. She currently has $200,000 in savings. Between her own contribution and her employer’s she puts 14 percent of her pay into a retirement account each year.
Then it reports:
“Forbus figures that she can retire comfortably on around $1 million, although if her house is paid off, she might be able to get by with a bit less. She is not factoring Social Security benefits into her calculations. ‘I feel like it’s too uncertain and not something I can depend on,’ she says.”
Given the economic and political realities around Social Security, it is absurd that Ms. Forbus, or anyone else, would make their plans for retirement based on the assumption that the program does not exist. In her case, her benefits are likely to make up a very substantial portion of her retirement income.
The piece tells that she earns a high five-figure income. Let’s assume that comes to $80,000 a year. In that case, if she retires in 15 years at age 65, she can expect benefits of roughly $39,200 a year (in today’s dollars). This would come to more than half of her current wage income (net of payroll taxes) of $73,900.
Even if Congress never did anything to shore up Social Security’s finances, and let benefits be cut by 20 percent, Ms. Forbus would still be getting $31,400 from the program, more than 42 percent of her current income net of payroll taxes. Based on the fact that she already has $200,000 in savings, is adding 14 percent of her salary each year, and will have a paid off mortgage, she should be able to look forward to a very comfortable retirement.
In short, if Ms. Forbus has fears about her retirement security, it is due to her having been misled about the health of Social Security. For this reason, it is unfortunate that the NYT piece chose to use her as the basis for a major piece on retirement income.
The reality is that most moderate and even middle-income workers are not anywhere near as well-prepared for retirement as Ms. Forbus. Many workers have accumulated little or nothing in the way of retirement savings, even as they are well into middle age. These workers have been failed by the current system of 401(k)s, since they will be dependent almost entirely on Social Security in their retirement. By contrast, Ms. Forbus is doing just fine, she just needs someone to tell her the truth about Social Security.
Read More Leer más Join the discussion Participa en la discusión
Actually, CNN wouldn’t say that, or at least not directly. What it said, in yet another major piece on how the economy is awful, is that prices are skyrocketing:
“The mix of local residents visiting the Enfield Food Shelf in Connecticut has changed a lot in the last few years.
“Prior to the Covid-19 pandemic, many were elderly or disabled people on fixed incomes, said Kathleen Souvigney, the food pantry’s executive director for the past decade.
“But now, more of the folks seeking assistance are working families who are struggling to make ends meet as their cost of living skyrockets. Paying for child care, housing, cars, heating and other basic needs doesn’t leave enough money these days for food, which has also risen sharply in price, Souvigney hears time and time again.”
The key piece of data that CNN apparently was unable to obtain for this article was wage growth. Wages have actually outpaced inflation in many of the items that have seen “skyrocketing” prices according to CNN. And, according to advanced economic theory, if wages are rising more rapidly than a price that is “skyrocketing,” then that wages must also be “skyrocketing.”
Here’s the picture.
Source: Bureau of Labor Statistics.
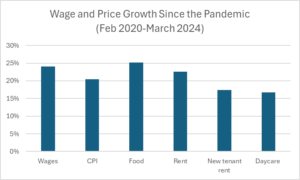
For wages, I have used the Bureau of Labor Statistics (BLS) average hourly wage for production and non-supervisory workers. This group covers roughly 80 percent of employees. It is useful because it excludes most high-end workers, so that the average is not skewed by high pay for CEOs and professionals.
As can be seen, this wage has risen by 24.0 percent since the pandemic began in February of 2020. This is 3.6 percentage points faster than the overall CPI. It is worth noting that, in contrast to prior decades, the fastest wage growth has been at the bottom end of the wage distribution.
That is not great, but there have been many periods, including the Reagan presidency, when wages have not kept pace with inflation. Furthermore, we have been hit with a worldwide pandemic that led to a huge burst of inflation everywhere. The fact that U.S. workers are actually doing better than before the pandemic is remarkable, and their real wages are on or slightly above the pre-pandemic growth path.
We can also compare the rate of wage growth to the inflation in some of the items highlighted in the CNN piece. Starting with food, inflation at the grocery store has slightly outpaced wage growth over this period, rising 25.2 percent compared to the 24.0 percent increase in wages. This puts a crimp in people’s budgets, but we have seen many periods in which food prices have outpaced wages by larger amounts.
Next, we have rent. As can be seen, the overall rent index has risen faster than the overall CPI, but less rapidly than wages. So workers are still coming out ahead here. But there is an interesting twist in this story.
In addition to its overall rent index, which follows the rents in all units, the BLS also has a “new tenant” rent index which tracks the rent in units that change hands. This index has risen just 17.4 percent since the start of the pandemic.
This is a big deal for this story for two reasons. First, low- and moderate-income people tend to move more frequently than higher-income people. This means the new tenant rent index might be a better approximation of the rents that the people discussed in this piece are facing.
The other reason the new tenant rent index is important is that it leads the overall rent index. At the start of 2021, the new tenant rent index began to show a large jump in rental inflation, as people looked for more space to accommodate working from home. This later showed up in more rapid rental inflation in the overall index.
In the last year and half, the picture has turned around with the new tenant index being flat or even falling. There is enough error in these measurements that it is hard to be very confident about where rental inflation will end up in the rest of 2024 and into 2025, but we can be quite certain that it will be considerably lower going forward than it is now. This should be a big help to low- and moderate-income households.
The last item is childcare. The index for childcare has risen just 16.7 percent, far less than the rise in wages.
There are two important qualifications that need to be added. There are undoubtedly huge differences in the costs faced by parents, depending on the specific childcare available. Most care is subsidized by the government. Where governments have cut back on support, parents have seen far larger increases in tuition.
The other issue is simply one of availability. Many childcare providers closed in the pandemic, and some did not reopen. As a result, the shortage of affordable childcare slots, which was already a big problem before the pandemic, is worse today.
CNN Highlights the Negative in the Biden Economy
To be clear, there are always bad stories in our economy, even in the best of time. Our system of social supports is far weaker than in other wealthy countries. As a result, even in boom times, there will be tens of millions of people struggling to pay for food, rent, healthcare, and other necessities. It is important that the public be made aware of this suffering.
However, it is also important that the media give a clear picture of the state of the economy. And, by most measures, the current economy is among the strongest in the last half-century, and that is in spite of having to shake off the effects of a worldwide pandemic.
We are doing far better than every other wealthy country right now. It is understandable that people care about their own situation, not the situation of workers in Germany and France, but they should recognize that the impact of a massive pandemic that cannot just be wished away by politicians. CNN and the rest of the media have done almost nothing to educate the public on this point.
Actually, CNN wouldn’t say that, or at least not directly. What it said, in yet another major piece on how the economy is awful, is that prices are skyrocketing:
“The mix of local residents visiting the Enfield Food Shelf in Connecticut has changed a lot in the last few years.
“Prior to the Covid-19 pandemic, many were elderly or disabled people on fixed incomes, said Kathleen Souvigney, the food pantry’s executive director for the past decade.
“But now, more of the folks seeking assistance are working families who are struggling to make ends meet as their cost of living skyrockets. Paying for child care, housing, cars, heating and other basic needs doesn’t leave enough money these days for food, which has also risen sharply in price, Souvigney hears time and time again.”
The key piece of data that CNN apparently was unable to obtain for this article was wage growth. Wages have actually outpaced inflation in many of the items that have seen “skyrocketing” prices according to CNN. And, according to advanced economic theory, if wages are rising more rapidly than a price that is “skyrocketing,” then that wages must also be “skyrocketing.”
Here’s the picture.
Source: Bureau of Labor Statistics.
For wages, I have used the Bureau of Labor Statistics (BLS) average hourly wage for production and non-supervisory workers. This group covers roughly 80 percent of employees. It is useful because it excludes most high-end workers, so that the average is not skewed by high pay for CEOs and professionals.
As can be seen, this wage has risen by 24.0 percent since the pandemic began in February of 2020. This is 3.6 percentage points faster than the overall CPI. It is worth noting that, in contrast to prior decades, the fastest wage growth has been at the bottom end of the wage distribution.
That is not great, but there have been many periods, including the Reagan presidency, when wages have not kept pace with inflation. Furthermore, we have been hit with a worldwide pandemic that led to a huge burst of inflation everywhere. The fact that U.S. workers are actually doing better than before the pandemic is remarkable, and their real wages are on or slightly above the pre-pandemic growth path.
We can also compare the rate of wage growth to the inflation in some of the items highlighted in the CNN piece. Starting with food, inflation at the grocery store has slightly outpaced wage growth over this period, rising 25.2 percent compared to the 24.0 percent increase in wages. This puts a crimp in people’s budgets, but we have seen many periods in which food prices have outpaced wages by larger amounts.
Next, we have rent. As can be seen, the overall rent index has risen faster than the overall CPI, but less rapidly than wages. So workers are still coming out ahead here. But there is an interesting twist in this story.
In addition to its overall rent index, which follows the rents in all units, the BLS also has a “new tenant” rent index which tracks the rent in units that change hands. This index has risen just 17.4 percent since the start of the pandemic.
This is a big deal for this story for two reasons. First, low- and moderate-income people tend to move more frequently than higher-income people. This means the new tenant rent index might be a better approximation of the rents that the people discussed in this piece are facing.
The other reason the new tenant rent index is important is that it leads the overall rent index. At the start of 2021, the new tenant rent index began to show a large jump in rental inflation, as people looked for more space to accommodate working from home. This later showed up in more rapid rental inflation in the overall index.
In the last year and half, the picture has turned around with the new tenant index being flat or even falling. There is enough error in these measurements that it is hard to be very confident about where rental inflation will end up in the rest of 2024 and into 2025, but we can be quite certain that it will be considerably lower going forward than it is now. This should be a big help to low- and moderate-income households.
The last item is childcare. The index for childcare has risen just 16.7 percent, far less than the rise in wages.
There are two important qualifications that need to be added. There are undoubtedly huge differences in the costs faced by parents, depending on the specific childcare available. Most care is subsidized by the government. Where governments have cut back on support, parents have seen far larger increases in tuition.
The other issue is simply one of availability. Many childcare providers closed in the pandemic, and some did not reopen. As a result, the shortage of affordable childcare slots, which was already a big problem before the pandemic, is worse today.
CNN Highlights the Negative in the Biden Economy
To be clear, there are always bad stories in our economy, even in the best of time. Our system of social supports is far weaker than in other wealthy countries. As a result, even in boom times, there will be tens of millions of people struggling to pay for food, rent, healthcare, and other necessities. It is important that the public be made aware of this suffering.
However, it is also important that the media give a clear picture of the state of the economy. And, by most measures, the current economy is among the strongest in the last half-century, and that is in spite of having to shake off the effects of a worldwide pandemic.
We are doing far better than every other wealthy country right now. It is understandable that people care about their own situation, not the situation of workers in Germany and France, but they should recognize that the impact of a massive pandemic that cannot just be wished away by politicians. CNN and the rest of the media have done almost nothing to educate the public on this point.
Read More Leer más Join the discussion Participa en la discusión
This is a line endlessly repeated in the media. Somehow, we face a terrible risk if people decide to have fewer kids. While this is the accepted wisdom in elite circles, there is remarkably little basis in reality for this view.
The latest piece pressing this line was a column in the Washington Post by Catherine Rampell headlined “Americans are having too few kids. The GOP made the problem worse.” The piece then points out that Republicans have opposed policies, like paid parental leave, subsidized child care, and expanded child tax credits that make it easier for families to raise kids.
To be clear, these are good policies, which reasonable people should support both to help parents and improve the lives of children. At this point, there is plenty of research showing the benefits to children, especially those from low- and moderate-income families, from these sorts of programs.
However, the question is whether we should support these policies because we need more people. Rampell tells us:
“As other countries have discovered, a population that fails to replace itself can face serious challenges. For instance, all else being equal, a shrinking workforce can lead to stagnant or declining living standards, because workers power the economy.
“Likewise, a shrinking contingent of young people means fewer workers are available to care for the growing elderly population and pay for its retirement benefits. Already, the typical American senior receives more Social Security and Medicare payments than they paid into the system. As the ratio of retirees to working-age Americans grows, this problem will worsen.”
This story is not well supported by the evidence. Countries that have declining populations can manage to do just fine in terms of improving living standards.
This point is well demonstrated by Japan, everyone’s favorite story of a country with a declining population. Japan’s population has been declining since 2005. Its population is roughly 2.5 percent lower now than it was 19 years ago.
That’s a fairly rapid decline, but the Japanese probably have not noticed they are suffering as a result. Per capita income in 2023 was 11.9 percent higher than in 2005. That’s not as good as the 23.7 percent growth in the United States, but better than many countries with stable or even increasing populations.
And this income figure is not giving us the full picture. Japanese workers have chosen to take a large share of the gains from productivity growth in the form of more leisure. Workweeks have gotten shorter and vacations have gotten longer over this period. According to the OECD, the length of the average work year for a Japanese worker has been reduced by 9.6 percent over this period. By contrast, it has fallen just 1.6 percent for workers in the United States.
There is no economic reason why people should value higher income more than increased leisure. Since its population began to decline, Japan has managed to have a substantial rise in per capita income and also a substantial increase in leisure for an average worker. This does not look like an economic disaster.
It’s also worth noting that these data do not pick up benefits of a smaller population like less crowding and less pollution. Other things equal, a smaller population means less time wasted in traffic jams and fewer people packed in at beaches or museums. If you face a years-long wait to get admitted to one of the more popular national parks, because they have limited places, think of what the situation is would be if the U.S. had twice as many people.
Similarly, other things equal, a smaller population means less pollution. Sure, we can adopt cleaner technologies that offset the impact of a larger population, but does anyone think that we will have cleaner technologies simply because we have more people?
Tokyo used to be a city where the cost of housing was ridiculous. Now it is touted as one of the most affordable major cities in the world. There is much more to this story than just population. Toyko has been very good at pushing policies that facilitate housing construction. But for any given housing stock, more people will mean higher prices.
On the point about fewer workers to support retirees, it’s worth noting that even modest gains in productivity growth swamp the demographic impact of a smaller ratio of workers to retirees. There can be problems associated with shifting resources, but that was also true when the baby boom generation was growing up and governments had to massively expand the school system to accommodate millions of new students.
Expanding the school system was certainly a problem back in the 1950s and 1960s. Similarly, there will be problems associated with the growth of Medicare and Social Security, but on the economic side, they will be manageable. As far as the politics, who can say? But that is a political problem, not an economic one.
Why Our Elites Worry About a Shrinking Population
Even if there is little basis for most people to be worried about the consequences of a declining population, there is a different story from the standpoint of our elites. The leader of a country has standing in the world based in large part on the size of their country’s economy.
This is one where it is not per capita that matters, but the absolute size. The world listens much more to the president of the United States than the prime minister of Norway because the U.S. economy is 50 times the size of the Norwegian economy, even though Norway has a larger per capita income. From the standpoint of politicians seeking to maximize their power, more people are definitely better.
This also applies to a much larger group of people who have the job of working for or advising government officials. Working in a high-level position for the president of the United States is a big deal. The same is not true for a minister in Latvia’s government.
It goes further. You can become a very prominent writer or academic by dealing with political battles in the United States, that is not the case with political analysts in Estonia. These people also have an interest in seeing a growing population. It makes the subject of their work more important.
In short, there is a clear divide in how people are impacted by a shrinking population. For most ordinary people, it is not a big deal and could well turn out to be a positive development. But for the elite types that get their views published in major media outlets, a declining population is definitely bad news.
Look for lots more stories about the horrors of a shrinking population.
Read More Leer más Join the discussion Participa en la discusión
This week the Federal Trade Commission (FTC) voted to ban noncompete clauses in most employment contracts. These clauses, which are now widely used, prohibit workers from working for another employer, or setting up their own business, for several years after quitting a job. These clauses are very common in employment contracts for veterinarians.
I mention this because we had direct experience with a vet who would have been precluded from setting up his own practice by one of these clauses. As it turned out, his employer made a mistake in writing the contract, so they weren’t able to enforce it. As a result, he was able to set up his own practice and treat our dogs.
This mattered because he was an extraordinarily good vet, who could think outside the box. One of the dogs he treated was Olive, a senior Doberman who had a rough life before we adopted her.
Olive had a number of health issues in the three years we had her, starting with heartworms when we adopted her. But she was able to run and play and enjoy life for most of that time.
Anyhow, she developed a malignant heart tumor at one point, which was causing her to cough constantly and was making her very weak. Our vet said that he could not save her from the tumor, but he did prescribe a type of mushroom, which apparently slowed the growth and alleviated the symptoms.
Olive had more than three full months in which she was able to enjoy playing with us and our other dogs. We were very happy for this.
We then adopted another Doberman, Noodle, with health issues. We originally took her to another vet (long story) who told us she had serious kidney failure. She said that Noodle might just have a few weeks or maybe as long as a year. (My wife is convinced that the “as long as a year” was a throwaway line to make me feel better.)
Anyhow, we took her to our regular vet who also recognized the serious kidney failure. He prescribed a probiotic, which apparently helped clean out her system, taking stress off the kidneys.
Noodle lived for three full years, most of it in good health. She also ran and played with our other dogs.
I could go on with more tales about our vet, but the point here is the benefit of banning noncompete agreements. If our vet had been bound by one of these agreements, he either would have been forced to practice in another place, or not work as a vet for a couple of years. Olive, Noodle, and his other patients would have suffered hugely as a result.
The issue goes well beyond our vet and veterinarians more generally. This is a basic issue of the benefits of competition and a market economy. If we think competition is a good thing, then we should value measures that enhance competition.
Noncompete clauses prevent workers from switching to jobs where their skills are more highly valued or from establishing their own businesses. The FTC’s vote was a victory not only for the workers who would otherwise be bound by these agreements, but a big win for the economy and society at large.
Read More Leer más Join the discussion Participa en la discusión
I have been complaining for years about the media’s coverage of the economy under Biden, but this NPR piece deserves a Pulitzer for awful reporting. It tells us that most students are unaware of the measures President Biden has put in place to reduce the debt burden faced by former students.
At one point it tells listeners:
“NADWORNY: Well, they’re not giving up on this issue [student debt relief], which is kind of amazing to hear, you know, after that tape from Elena.”
Actually, it is totally amazing that a serious news outlet would be surprised that the Biden administration is trying to tell people about programs that would benefit them. NPR apparently does not know about the most important program that would benefit almost all borrowers who are seriously burdened by debt.
President Biden made the already existing income-driven repayment plan far more generous. Under the new structure he put in place, a single individual who earned less than $32,000 a year would pay zero towards their student debt. If they earned $40,000 a year, they would pay $60 a month.
While it is astounding that NPR could do a major piece on the burden of student debt without mentioning Biden’s income-driven repayment plan, it has good company in doing awful reporting on this issue. In the last year, the New York Times has done two major pieces on student debt and college costs without ever mentioning the income-driven repayment plan.
Read More Leer más Join the discussion Participa en la discusión