


This is apparently news to BlackRock CEO, who is apparently believes it is still 65, according to a New York Times Dealbook piece.
“No one should have to work longer than they want to. But I do think it’s a bit crazy that our anchor idea for the right retirement age — 65 years old — originates from the time of the Ottoman Empire.”
The reforms to Social Security put in place in 1982 provided for a gradual increase in the normal retirement age from 65, for people turning 62 before 2002, to 67 for people turning 62 after 2022. It is also important to recognize that there is not a single age where workers start collecting benefits. They can begin getting benefits as early as age 62, but their payment will be reduced by roughly 6.0 percent for every year between the normal retirement age and the age where they start collecting benefits.
This means, for example, that a person who starts collecting benefits this year at age 62 would get roughly 30 percent less than their full scheduled benefit. (This is age 67 minus 62 [5 years] times 6 percent.)
For people who start collecting benefits after the normal retirement age, benefits increase by approximately 8 percent a year. This means that if someone who is 62 today waits until age 70 to start collecting benefits, they will get a boost to their benefits of roughly 24 percent (3 years times 8 percent). For this reason, the focus on the retirement age can be misleading, the issue is really a schedule of benefits.
This is important to keep in mind for those who think it would be good for people to work later in life. There is an obvious route to pursue if we want people to retire later that doesn’t involve reducing benefits. Instead of cutting off at age 70, we could have benefits increase to age 72 or even later.
This change is costless since the increase is set based on people’s life expectancy. That means that if people retiring at age 72 get 16 percent more each year than people who start collecting benefits at age 70, they can expect to collect benefits for a period that is 16 percent shorter. This is a simple and costless fix that should give people an incentive to retire later, if that is the outcome we are looking for.
It is also worth noting that if we think AI will take all the jobs then it is foolish to be worried that we need older people to work longer. We will not be facing a shortage of labor in that story.
Read More Leer más Join the discussion Participa en la discusión
I was more than a bit surprised to see the profit data this morning. I really did believe that the profit surge during the pandemic was a one-off, associated with supply-chain issues.
We can argue about how much of this increase was a predictable story, where profits rise due to shortages, and how much was about companies exploiting market power to jack up prices, but the fact that profit shares increased is not disputable. In any case, it was reasonable to expect that profits would return to their pre-pandemic shares after supply chains returned to normal.
That doesn’t look like what is happening, as shown below.
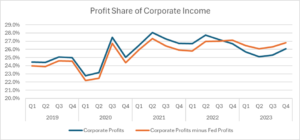
Source: BEA and author’s calculations, see text.
The profit share of corporate income rose to 26.8 percent in the fourth quarter from 26.3 percent in the third quarter. That is down only 0.5 percentage points from its pandemic peak of 27.3 percent in the second quarter of 2021 and well above the 24.3 percent average for 2019.[1]
This rise in profit shares really should have the Fed rethinking its inflation-fighting strategy. It is certainly true that the 6.0 percent rate of wage growth at the end of 2021 and start of 2022 was inconsistent with the Fed’s 2.0 percent inflation target. However, the current rate of roughly 4.0 percent is obviously consistent with the Fed’s target, if it is allowing companies to increase their profit share. This implies that we should actually want to see a somewhat more rapid pace of wage growth, unless we think profit shares need to be increasing indefinitely.
There are a couple of important qualifications here. First, we saw extraordinary productivity growth in 2023. Clearly corporations were the main beneficiaries of this growth. If this uptick was an aberration and we revert to something closer to the pre-pandemic growth rate, then profit shares may not continue to rise with a 4.0 percent pace of wage growth and could even edge back somewhat.
The other big qualification is that there is a large and unusual discrepancy between GDP measured on the income side and GDP measured on the output side. In principle these sums should be identical, but in a $28 trillion economy, they never come out exactly the same.
In recent decades, the income side has generally been about 0.5 percentage points higher than the output side. In the fourth quarter, the income side was 2.0 percentage points lower. We usually assume that the true figure lies somewhere between the two measures.
This would imply that the true sum of wages and profits is 1.0 to 2.0 percentage points higher than what is now reported. If that gap ends up being disproportionately wages or profits it could change the picture somewhat, but even if the full 2.0 percentage points all ended up being wage income it would not change the fact that the profit share is still far above its pre-pandemic level.
The upshot is that it really is time for the Fed to declare “Mission Accomplished” and take its foot off the brake. If profit shares are rising, there is no reason for it to be trying to slow wage growth.
[1] These figures take Line 8 (net operating surplus) from NIPA Table 1.14, minus Line 11 (Federal Reserve Bank profits) from Table 6.16D divided by Line 8 plus Line 4 (labor compensation) from Table 1.14.
I was more than a bit surprised to see the profit data this morning. I really did believe that the profit surge during the pandemic was a one-off, associated with supply-chain issues.
We can argue about how much of this increase was a predictable story, where profits rise due to shortages, and how much was about companies exploiting market power to jack up prices, but the fact that profit shares increased is not disputable. In any case, it was reasonable to expect that profits would return to their pre-pandemic shares after supply chains returned to normal.
That doesn’t look like what is happening, as shown below.
Source: BEA and author’s calculations, see text.
The profit share of corporate income rose to 26.8 percent in the fourth quarter from 26.3 percent in the third quarter. That is down only 0.5 percentage points from its pandemic peak of 27.3 percent in the second quarter of 2021 and well above the 24.3 percent average for 2019.[1]
This rise in profit shares really should have the Fed rethinking its inflation-fighting strategy. It is certainly true that the 6.0 percent rate of wage growth at the end of 2021 and start of 2022 was inconsistent with the Fed’s 2.0 percent inflation target. However, the current rate of roughly 4.0 percent is obviously consistent with the Fed’s target, if it is allowing companies to increase their profit share. This implies that we should actually want to see a somewhat more rapid pace of wage growth, unless we think profit shares need to be increasing indefinitely.
There are a couple of important qualifications here. First, we saw extraordinary productivity growth in 2023. Clearly corporations were the main beneficiaries of this growth. If this uptick was an aberration and we revert to something closer to the pre-pandemic growth rate, then profit shares may not continue to rise with a 4.0 percent pace of wage growth and could even edge back somewhat.
The other big qualification is that there is a large and unusual discrepancy between GDP measured on the income side and GDP measured on the output side. In principle these sums should be identical, but in a $28 trillion economy, they never come out exactly the same.
In recent decades, the income side has generally been about 0.5 percentage points higher than the output side. In the fourth quarter, the income side was 2.0 percentage points lower. We usually assume that the true figure lies somewhere between the two measures.
This would imply that the true sum of wages and profits is 1.0 to 2.0 percentage points higher than what is now reported. If that gap ends up being disproportionately wages or profits it could change the picture somewhat, but even if the full 2.0 percentage points all ended up being wage income it would not change the fact that the profit share is still far above its pre-pandemic level.
The upshot is that it really is time for the Fed to declare “Mission Accomplished” and take its foot off the brake. If profit shares are rising, there is no reason for it to be trying to slow wage growth.
[1] These figures take Line 8 (net operating surplus) from NIPA Table 1.14, minus Line 11 (Federal Reserve Bank profits) from Table 6.16D divided by Line 8 plus Line 4 (labor compensation) from Table 1.14.
Read More Leer más Join the discussion Participa en la discusión
David Wallace-Wells had a column discussing the trip by Javier Milei, Argentina’s new president, to the World Economic Forum (WEF) in Davos, Switzerland. The WEF is an annual gathering of many of the world’s richest people, where they also invite politicians, academics, and others who they think may amuse them. According to Wallace-Wells, Mr. Milei definitely fits into that category.
The piece talked about how Milei calls himself as an anarchist, with the government just doing basic functions, like defending the country and running the criminal justice system. Otherwise, Milei would eliminate any role for government, if he had his choice.
It is humorous to hear politicians make declarations like this. As a practical matter, almost all of these self-described anarchists would have a very large role for the government. What they want to do is to write the rules in ways that sends income upwards and then just pretend it is the natural order of things.
Patent and Copyright Monopolies
The best place to go to start ripping off the phony face of these “anarchists” is with government-granted patent and copyright monopolies. These monopolies, which make folks like Bill Gates incredibly rich, are not part of any natural order. They are explicit government policies designed to promote innovation and creative work.
It is possible to argue for these government-granted monopolies as good policy, but that doesn’t change the fact that they are government policies. It is just a lie to say that you don’t want the government intervening in the market and then support these monopolies.
The lie also has the effect of avoiding a serious debate on the relative merits of these mechanisms for supporting innovation and creative work, compared to other mechanisms. People like Milei pretend that copyrights and patents are just the natural working of the market, whereas other mechanisms, like publicly funded open-source research and creative work are government interventions.
This means that even if these other routes are more efficient, Milei doesn’t want them to be discussed. Oh yeah, if patents and copyrights happen to send a huge amount of income upward, well we don’t have to talk about that.
And let’s be clear, we are talking about a huge amount of income. It’s likely more than $500 billion a year ($4,000 for every family) in the case of prescription drugs alone. In total we are almost certainly talking about more than $1 trillion a year, a sum that is close to half of after-tax corporate profits.
The Privilege of Incorporation
It’s always fun to ask anarchist-libertarian types if they want to get rid of corporations. It usually draws a blank stare.
It shouldn’t, because corporations are creations of the government. We can have individuals agree to work together in partnerships, but you need big bad government to create a corporation, an entity that has a distinct identity from the people who own it.
This is a big deal for many reasons. The most obvious one is that a corporation can go bankrupt, stiffing its creditors, even as the shareholders retain their wealth, apart from what they invested in the company’s shares.
This is an especially big deal when the creditors did not voluntarily lend money, such as a neighborhood wrecked by chemical contaminates or the patients who took a drug that turned out not to be safe. Suppliers who delivered goods or workers promised pensions can also find themselves as unintentional creditors.
The anonymity allowed by corporate status can also allow individuals to profit from activities that they would rather not be identified with, such as selling tobacco, guns, and pornography. Corporate status allows investors to hide in a way that would not be true of partnerships.
When the government passes laws allowing incorporation it also sets up rules for corporate governance. These rules determine who is likely to benefit most from corporate status. In the United States the rules are much more friendly to top management than elsewhere. As a result, our CEOs tend to get far higher pay than their counterparts at large successful companies in other wealthy countries. This matters not only for the CEOs, but for top management more generally, and skews the pay structure in the economy as a whole.
Rules of corporate governance can also require some role for stakeholders other than shareholders. In Germany, large companies are required to include worker representatives on their board. There is no natural set of rules of corporate governance, they are set by governments. The libertarian bible won’t help here.
Labor Unions
Another area where self-imagined anarchist libertarians often have trouble is with labor unions. If we let people associate with whoever they want, presumably workers are free to get together and act collectively just like businesspeople can get together to form a partnership. So good libertarians have to accept unions.
But what are the boundaries for union activities? Can unions, or their members, be liable for the damage a company suffers as a result of a strike? There have been many efforts over the years to make workers pay for a company’s losses from a strike. Can unions sign contracts that require all of a company’s workers to pay a representation fee to the union?
What about secondary boycotts? Can the Teamsters refuse to make deliveries to a restaurant or hotel being picketed by its workers?
These questions and others are policy issues that can be decided any number of ways. The desire to “get the government out” provides no help here. The government is in whether we like it or not.
The “Libertarian” Philosophy is Lie, Why Pretend Otherwise?
I could go on at length and show other ways in which most people who call themselves libertarians are happy to have the government intervene in the economy. (This is the main point of my book Rigged [it’s free].) In almost all cases the effect of their approved interventions is to redistribute income upward.
It is totally understandable that people like Milei would like to conceal their approach in an anarchist-libertarian philosophy. After all, it sounds much better to run around saying that you support anarchist principles and get the government out of the economy than to say that you want the government to intervene in ways that give all the money to rich people.
The part of this story that is hard to understand is why people who don’t want to give all the money to the rich accept the claims of the “anarchist-libertarians” at face value. We get people absurdly arguing against “free-market fundamentalists,” like they are arguing against the market.
This makes zero sense. The market is a tool, like the wheel. It makes no more sense to argue against the market than to argue against the wheel. We all want to use the market in the same way we all want to use wheels. We are arguing over how best to use it.
It is both bad politics and terrible policy to pretend that the enemy of progressive change is somehow the market. The issue is how best to shape the market. We can’t have this discussion if we pretend that people like Milei are sincere in wanting to get the government out of the economy.
Let the rich at Davos enjoy this clown show. Serious people need to deal with reality.
Read More Leer más Join the discussion Participa en la discusión
There is a steady drumbeat from people intent on making a major issue over the fact that many cities may have kept their schools closed for too long during the pandemic. The argument is that children were generally less susceptible to Covid than the rest of the population and closing schools did little to stem the spread of the pandemic.
Based on these facts, they argue that we had a massive preventable loss in learning. This loss is especially serious for children from under-privileged backgrounds, whose families do not have the resources to help their kids close the learning gap.
The places where schools had remote or hybrid classes longest were mostly cities with Democratic mayors and/or strong teachers unions. Therefore, we should blame these liberal types for hurting the people they ostensibly care about.
The latest piece of ammunition for these critics came in a study from a number of prominent researchers showing that children in schools that were closed for longer periods of time fell furthest behind during the pandemic. This effect was largest in the poorest school districts.
This study was written up in a major article in the New York Times. The piece noted that students in the schools closed longest fell more than half a year behind as a result of the pandemic.
There seem to be many people anxious to mispresent the findings of this study. While it does show that students fell further behind the longer their schools were closed, it also shows that the bulk of the learning loss was due to the pandemic, not the school closings.
In the schools that were closed for the shortest duration, students in grades 3 through 8, fell 0.35 years behind grade level on math scores. In the schools that were closed longest they fell 0.57 years behind. This means that the extra period of closing was responsible for a loss of 0.22 years, roughly 40 percent of the total. And this is the additional loss for schools that were closed longest compared to schools that were closed the shortest, most obviously fell somewhere in the middle.
Of course, it is better not to have students lose any ground in their education, especially those from under-privileged backgrounds. But we need to be clear that even in the most extreme cases the issue was the 0.22 years, not the full pandemic loss.
And requiring in-person instruction did pose real risks, if not to the students, certainly to teachers and their families. It is understandable that a teacher with a serious health condition, or who had a family member with a serious health condition, would be reluctant to expose themselves to the pandemic any more than absolutely necessary, at least until the vaccines were widely available. And it is certainly understandable that the unions that represented these teachers would act to protect them.
We can argue that the cities that gave in to pressure from teachers and their unions made the wrong call, but we need to have a clear eye of what was at stake. It was 0.22 years of learning – definitely an unfortunate loss, but probably not something we would consider a disaster in most contexts.
Vaccines for the World?
While the New York Times has ample space for the argument that we kept schools closed longer than necessary, it’s worth noting something that we don’t see widely being relitigated: the availability of vaccines, as well as tests and treatments. Given the extraordinary nature of the worldwide Covid pandemic, it would have been reasonable to suspend normal rules on patents and intellectual property and have worldwide sharing of technology related to vaccines, tests, and treatments.
This would have meant an international agreement where the United States, Europe, China, India, and everyone else involved in research related to the pandemic would agree to make all their relevant technology fully open. This means putting everything up on the Internet so that researchers everywhere had access to the same knowledge that they could criticize and build on.[1]
It also meant that as soon as a technology was shown to be successful, anyone anywhere could take advantage of it. There have been many boasts about the speed with which Operation Warp Speed developed effective vaccines. This was indeed impressive, but effective vaccines were also developed in roughly the same time frame in China and Europe, and only a little bit slower in India and Cuba.
Vaccines were in short supply in much of the world in 2021 and into 2022. If all the vaccines were fully open-sourced, so that anyone could produce them, we almost certainly would have vaccinated the bulk of the world’s population much more quickly. This would have hugely slowed the spread, likely preventing the development of the omicron strain and possibly even the delta strain. Millions of lives could have been saved and tens of millions of infections prevented.
Would all the countries of the world have agreed to this sort of pandemic cooperation? We’ll never know, but we do know that we didn’t try and the failure to have such cooperation was enormously costly in terms of lives lost, health, and economic damage.
It might be worth giving some thought to this issue. We can spend as much time as we want beating up liberals for respecting teachers’ health concerns, at the cost of 0.2 years of lost learning. But maybe we can also spend a little time asking if there are not ways to do medical research that better serve society, even if they may perhaps not be as good for the pharmaceutical industry’s profits.
[1] We could compensate companies after the fact for the profits that they lost due to the sharing of their technology.
Read More Leer más Join the discussion Participa en la discusión
It’s amazing how so many arguments in policy circles are transparently self-contradictory. Ross Douthat gave us a fantastic example in a NYT column defending Donald Trump’s bloodbath comment.
Douthat defends Trump by arguing that his bloodbath referred to the need to protect the U.S. auto industry from Chinese cars. This is arguably what Trump meant, but not what he said. I suppose we can give a pass to someone in Donald Trump’s mental condition.
But the neat part of the story is that Douthat goes on to criticize the plans announced by the E.P.A. to accelerate the switch to electric cars. Douthat argues that this is terrible politics since it will be forcing people to buy cars they don’t want. He says people want traditional gas-powered cars and the Biden administration is pushing electric cars down their throats.
Okay, let’s get back to Donald Trump’s bloodbath. The Chinese cars that Trump wants to keep out of the U.S. with really high taxes (tariffs) are electric.
Many are now as cheap or cheaper to buy than equivalent gas-powered vehicles and far cheaper to fuel and maintain over their lifespan. This is why Trump insists on high taxes to keep people from buying them.
So to recap, Ross Douthat is telling us that Biden is trying to shove electric cars down consumers’ throats that they don’t want, while also implicitly defending Donald Trump’s plans to impose high taxes so that consumers won’t buy Chinese electric cars that he apparently thinks they do want.
That sort of argument might make sense on the New York Times opinion page, but not in reality-land.
Read More Leer más Join the discussion Participa en la discusión
I have long been amazed at how major debates over various economic policy issues can have completely contradictory assumptions, and no one seems to notice. This was driven home to me by a New York Times column by Peter Coy (a very good columnist) where he addressed the issue of whether AI would take all our jobs.
This risk has been arousing some concern in social media and various publications. This is striking because the prospect of no jobs raises a set of concerns that is 100 percent in the opposite direction of the frequently expressed problem of budget deficits and debt, as well as the problem of an aging population.
To put the issue as simply as possible, the story of AI taking all the jobs is a story where we can produce too much. The idea is that people don’t have jobs because there is no demand for their labor, AI is doing all the work.
This is the exact opposite of the budget deficit problem or the aging problem. Both of these are stories of scarcity. The deficit story is that government spending, given current tax structures, is pushing the economy beyond its capacity to produce goods and services.
If we are not hitting the economy’s capacity then we can just print the money, no matter how large the deficit is. We only get inflation if we push the economy beyond its ability to produce goods and services.
It’s a similar picture with the aging population story. The argument here is that we have too few workers to support a growing population of retirees. We would need ever higher taxes on the working population if we are to provide retirees with food, housing, healthcare and other necessities.
It is possible to construct stories where AI will lead to massive overproduction and an enormous reduction in the demand for labor. It is also possible to construct stories where large budget deficits push the economy up against constraints, leading to inflation, or where the aging population requires much larger taxes on workers.
However, it is not possible to put both stories together. If we really have to worry about AI radically reducing the demand for labor, then we don’t have to worry about the size of our budget deficit or debt. We also don’t have to worry about the rising ratio of retirees to workers. AI will take care of that, providing the goods and services our elderly need.
As far as my own view, I lean towards the AI taking the jobs story, although perhaps my scenario would not be as dramatic as some have been suggesting. I’m sure AI will have a big productivity impact in many sectors, but it is not going to be instantaneous.
We will gradually see reduced demand for lawyers, accountants, engineers, and in hundreds of other occupations. This will translate into lower prices for many items, which means higher real wages for workers in sectors seeing fewer layoffs. That should mean increased demand, as these workers spend their pay, which will create new jobs.
Of course, there is no guarantee that the benefits of increased productivity will accrue to workers, although that has generally been the case in the past. (The wage stagnation since 1980 has largely been a story where the wages of workers at the middle and bottom of the distribution went to workers at the top end like CEOs and Wall Street types.) We need policies to ensure that the productivity gains from AI are widely shared.
Just to be clear on this point, the issue is not one of government “redistribution,” as it is often framed. Government rules, not the market, will determine how the bigger pie associated with AI gets cut. There is no natural market distribution.
Just to take the most obvious and important example, ownership of AI is bestowed by government-granted patent and copyright monopolies. These are government policies, not the market.
Without these monopolies, it is unlikely that any company and/or individuals would be in a position to hugely profit from AI. Imagine that all AI software was fully open and could be used by anyone at zero cost. Also, the software embedded in the servers that power AI was fully open, so that anyone with a factory could replicate the servers. In this case, AI would likely be very cheap for anyone who saw a use, which means its benefits should be quickly passed on in the form of lower prices.
The government can take steps to ensure that gains are broadly shared. A higher minimum wage to go along with higher productivity would be an obvious measure. (We used to raise the minimum wage in step with productivity, it would be over $24 an hour today if we had continued this practice.)
We can also reduce the standard workweek. Instead of having overtime pay kick in at 40 hours a week, we can set the cutoff at 36 hours or 32 hours, or even less, depending on how much AI is increasing productivity.
And we could use our AI productivity dividend to spend more in areas like health care and education, as well as cleaning up the environment. All of which will be possible without higher taxes due to the AI increasing our output.
Again, I don’t see us stumbling into a world of unbelievable plenty tomorrow, but I do think AI offers enormous potential for productivity gains that can be broadly shared with the right policies. There really is not a basis for fears that we won’t have any jobs, but the fact that the issue is even raised means that we likely don’t have to worry about budget deficits or not having enough workers due to an aging population.
Read More Leer más Join the discussion Participa en la discusión
The New York Times ran one of its obligatory pieces on the horror story created by the growing government debt. The immediate instigation was a new report from the Congressional Budget Office that the debt to GDP ratio will hit a record high in 2029.
The piece included a paragraph on the horrors of this situation.
“‘This is yet another reminder that politicians put political priorities ahead of the long-term health of the country,’ Maya MacGuineas, president of the Committee for a Responsible Federal Budget, said in a statement. ‘There is no way to look at these eye-popping numbers without realizing we need to make a change.’ “
One way to improve the situation for those concerned about debt to GDP ratios is to adopt the old practice of tax farming. This was a practice common, among other places, in pre-revolutionary France. The government would sell off the right to collect a specific tax, such as a tariff at a particular port.
Selling off the right to collect a tax is a way to reduce the debt. It is a terrible economic practice, since privately collected taxes are likely to create a large amount of economic distortion and reduce output, but it does lower the debt. We can certainly go this route if it will make the people concerned about the government debt happier.
As a practical matter, the government still does something very similar to tax farming. It gives out patent and copyright monopolies that allow companies to charge prices that are hugely higher than the free market price.
The government uses these monopolies to pay for a large amount of innovation and creative work. They result in much higher prices for the protected items. In effect, we are allowing the beneficiaries of patent and copyright monopolies to charge a tax, just like in the good old days of tax farming, except instead of selling the right to collect the tax we are using the right to collect the tax as a way to pay for services the government wants performed.
And the neat thing about paying for services by issuing these monopolies is that it is entirely off the books. No one keeps track of the value of these monopolies, not even the deficit scolds who are always yelling at us about the need to reduce the deficit and debt.
It’s also important to recognize that we are talking about big bucks here. In the case of drugs alone, it is likely that the annual payments, due to higher drug prices, cost us more than $500 billion (1.8 percent of GDP) this year. We will spend more than $600 billion for drugs that would almost certainly cost us less than $100 billion in a free market. Drugs that can sell for tens of thousands for a year’s dosage would typically sell for a few hundred dollars in a free market.
The extra $500 billion a year that we pay for drugs comes to over $4,000 a family. It’s almost 60 percent of what the federal government will pay out in interest this year. And no one even knows about it. And this is just for drugs.
We pay hundreds of billions extra every year for items like software, smartphones, computers, video games, medical equipment, pesticides and fertilizers, and many other types of products because of these government granted monopolies. The total annual take from these rents is almost certainly well over $1 trillion, a sum that would far exceed current interest payments on the debt.
The country would surely be better off if the federal government paid out less money in interest every year. Those interest payments allow the beneficiaries to consume more than would otherwise be the case, leaving us with fewer resources for other consumption and investment.
The same story applies to the patent rents paid to drug companies, computer and software makers and the others who receive them. However, for some reason, we literally never hear a word in the media about these massive payments.
If the concern is really the drag that interest payments will be on the economy in future years, and that our children will somehow be less wealthy as a result (anyone hear of climate change?), then it makes zero sense to harp on interest payments and ignore patent and copyright rents.
Of course, if someone has a political agenda to reduce Social Security, Medicare, and other social programs, then this narrow focus would make sense. If this just a conceptual problem, and the deficit hawks can’t understand how patent rents and interest payments are two sides of the same coin, then maybe we should just do some large-scale tax farming to reduce the debt, and everyone can be happy.
Read More Leer más Join the discussion Participa en la discusión
The New York Times opinion section seems determined to promote an alternative reality about the economy. Today it featured a column by Ashley Goodall, a former executive at Cisco Systems, telling us why mass layoffs in tech are bad.
While Goodall makes several good points about layoffs being both bad from the company’s long-term perspective, in addition to obviously being bad for workers losing their jobs, there is a fundamental problem with the story. Layoffs are actually down in the tech sector.
The Bureau of Labor Statistics does not have a category defined as “tech,” but the larger information category, which includes most of the areas that would be considered tech, shows that layoffs are rarer than in the past. The discharge rate averaged 1.1 percent in 2023. That compares to 1.4 percent in 2019 and 1.2 percent in the prior two years. We would have to go back to 2016 to see a lower discharge rate in the sector. (The rate fell to 0.6 percent in January, the most recent month for which we have data.)
It’s possible that if we looked to a more narrow sector that could be considered “true” tech we would find a higher layoff rate, but this would mean we are considering a small segment of the workforce. As it is, the 3.0 million people employed in the information sector account for less than 2.0 percent of the workforce or about 15 percent of the number of people working in restaurants. If we whittled this down further to find a sub-sector where layoffs have been soaring, but not enough to move the needle for the larger information category, we are talking about a small group of workers.
There may be a story of large layoffs at a small number of high-profile companies, like Meta, which is highlighted in the piece, but this is not a story that tells us much about the larger economy or the labor market. It is wrong to misrepresent the data this way.
Read More Leer más Join the discussion Participa en la discusión
There is an old saying that in Washington, no bad idea stays dead for long. The Patent Eligibility Restoration Act (PERA), proposed by Senators Thom Tillis (R-NC) and Chris Coons (D-DE) seems designed to prove that proposition.
The basic idea behind the act is to increase the types of things for which people and corporations can get government-granted patent monopolies. These could raise the price of a wide range of items from prescription drugs and medical procedures to computer software and smartphones. It is also likely to mean billions of dollars more being wasted every year in patent suits and related litigation.
Few people seem to recognize how important patent monopolies are in the distribution of income. We will pay more than $600 billion this year on drugs (almost $5,000 per family) that would likely sell for less than $100 billion in the absence of patent monopolies or related protections.
Drugs are almost invariable cheap to manufacture and distribute. They are expensive because the government has given a monopoly to the company that produces them and will arrest any competitors. When a drug is needed for someone’s health or even life, that means drug companies can charge tens or even hundreds of thousands of dollars.
When you hear of families struggling to raise $100,000 for their kid’s cancer treatment, that is not because the drugs are expensive. It’s because the government-granted monopoly allows a drug company to charge an outlandish price.
And drugs are just part of the story. Patent monopolies cause medical equipment, computer software, computers, and many other items to cost far more than they would in a free market. Taken together, patent monopolies and related protections almost certainly cost us over $1 trillion a year.
There are strong economic and moral arguments for making these monopolies shorter and weaker. Among other things, they encourage drug companies to lie about the safety and effectiveness of their drugs.
We could just pay for the research upfront – we already spend close to $60 billion a year on research through the National Institutes of Health and other government agencies – and let new drugs be sold as cheap generics. But the industry would kill to prevent this sort of outcome.
In any case, it is absurd to go in the opposite direction and look to have more areas with government-granted patent monopolies as PERA would do. Among other things, it would allow companies to claim patents on genes they identified. This would radically raise the cost of treatments and medical research.
It would also allow patents on a range of abstract scientific discoveries and innovations. This brings back memories of two famous patent cases from the 1990s. Apple sued Microsoft when it introduced Windows, claiming that the new menu-based system infringed on Apple’s operating system by having the same “touch and feel.” Thankfully, the courts sent Apple packing on this one.
There was a similar story when Amazon attempted to claim a patent on one-click shopping. Having your system save customers’ information might have seemed a rather obvious approach once we had Internet shopping, but Jeff Bezos thought everyone should have to pay him a fee for using this method. Again, the courts sent Bezos packing.
However, with PERA, Amazon may have had a case. After all, if they had raced to the patent office they might have had a valid patent.
This is the sort of nonsense that we can expect to see in large quantities if PERA becomes law. It is 180 degrees at odds from what we should be encouraging businesses to do. We want them to develop better ways to do things and produce better products, not more creative ways to game the patent system. PERA will be a great bonanza for patent lawyers, but really bad news for just about everyone else.
Read More Leer más Join the discussion Participa en la discusión
Okay, I’m not really defending private equity, but I do have to point out that Marc Hogan has badly misrepresented the problems in the music industry in his New York Times column this morning.
Hogan would have us believe that we have a thriving music industry that is being swallowed up by money-grubbing private equity companies that now lay claim to a large share of artists’ recordings. While private equity companies undoubtedly engage in many sleazy practices, the fact is that the industry is hardly thriving. Hogan gets the story completely wrong.
He tells readers:
“The music industry’s revenues recently hit a new high, with major labels raking in record earnings,”
The link is to an industry publication that reports revenue from recorded music for the first half of 2023 at a record $8.4 billion. That would translate to $16.8 billion on an annual basis. If we go back to 2000, before streaming or digital downloads were common, sales were $19.1 billion. In nominal dollars, the economy is more than two and half times as large today as in 2000.
This means that if recorded music was as large a share of the economy today, as at the start of the century, revenue would have to be almost $45 billion a year. Relative to the size of the economy, streaming revenue is just over one-third as large today as in 2000. (Some of the revenue in 2000 went to the manufacture and distribution of physical discs, but this would have been a small share of the total.) This loss of revenue is the core problem with the music industry, not the dealings of private equity companies.
As a practical matter, rapacious corporations or promoters ripping off musicians is not exactly a new story. It’s possible that it is worse today, but it is absurd to imagine a golden age where most musicians could count on being paid well for their work.
Hogan inadvertently gives away the story when he cites Spotify’s decision to stop sending out royalty checks for songs with fewer than 1,000 streams in a year. People who follow his link would find that 1000 streams would net a performer $3. Things would have to be pretty bad indeed if that is going to make a noticeable difference for “artists on the lower rungs.”
The real problem is that we need to find ways to get more money to musicians and songwriters. The current system is not working and that would be true even if private equity didn’t exist.
There are alternatives that can do the trick, such as individual tax credits to support creative work. I have suggested a similar route for reviving local journalism, another area where the NYT is badly out to lunch.
There is an old saying that intellectuals have a hard time dealing with new ideas. The New York Times opinion section seems determined to demonstrate its truth on a regular basis.
Read More Leer más Join the discussion Participa en la discusión


