

April 15, 2011

CEPR often mentions the long-term economic slowdown that hit low- and middle-income countries beginning in the 1980s. But as our recent Scorecard shows, over the last 10 years something remarkable has happened: low- and middle-income countries have begun growing again, at rates rivaling those they had before 1980.
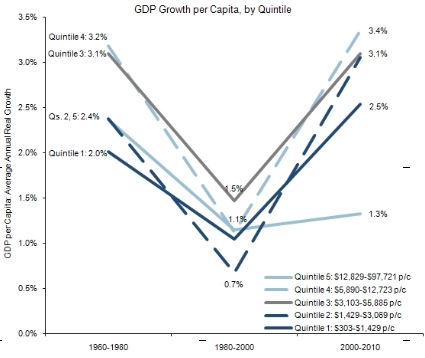
This collection of “V” shapes shows economic growth for 191 countries, divided into quintiles from poorest to richest.i Every quintile saw its GDP slow by about half – or more – between 1980 and 2000. Quintile 2 (low-income countries with between $1,429 and $3,103 in per-capita GDP) actually saw GDP slow by two-thirds. But after 2000, the low- and middle-income groups saw their growth rebound to at least as high as it was before 1980. Only the fifth quintile (rich countries with at least $12,829 in per-capita GDP) saw continued stagnation: their GDP inched up from an average of 1.1% per year to 1.3%.
Why did progress slow so dramatically for 20 years and then speed up again? Those two decades saw widespread adoption of neoliberal economic policies: tighter fiscal and monetary policies; reduced tariffs and non-tariff barriers to trade; financial deregulation; privatization of state-owned enterprises; increased protectionism in the area of intellectual property; and the general abandonment of state-led industrialization or development strategies. It would be nearly impossible to econometrically identify the contributions of various reforms to the slowdown, but the fact that these reforms coincided with such a sharp, long-term decline for the vast majority of low- and middle-income countries is at least prima facie evidence that on the whole, these reforms contributed to the failure.
Why the rebound? We would expect to see an eventual rebound even if the reforms were never reversed. After all, even the former Soviet states that suffered badly through “shock therapy” during their transitions eventually recovered. In other countries, failed policies were abandoned: after the Asian crisis of the late 1990s, many countries began accumulating reserves to avoid repeating their fate or ever having to borrow again from the IMF. The IMF’s lending portfolio shrank by 80% from 2003 to 2007. And the IMF has learned from its past: though contractionary conditions are still common in IMF agreements, the lender has reversed austerity conditions on some loans since the recent global recession began, and created over a quarter-trillion SDRs (its reserve currency) to cushion the recession’s impact on member country reserves. Between an intentional turn away from the IMF and neoliberal policies, the IMF’s own improvements, and the passage of time, it seems developing countries may have closed the door on the stagnation of the 1980-2000 period.
What about the rich countries and their lack of progress? While much of the developing world has turned the page on its neoliberal era, rich countries (especially the United States and Europe) are embracing austerity as a way out of their ongoing recession and stagnation. Several of these countries, such as Greece and Spain, are projected to have even less growth in the future, as austerity’s impact is felt over the coming years. Perhaps rich countries can learn from the experiences of their developing neighbors and abandon policies that have failed elsewhere.
A similar pattern shows up with health outcomes, especially on indicators that can change quickly like child mortality:
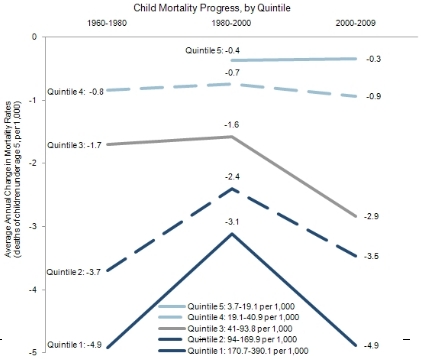
Here the “V” shapes are inverted, because the goal is to lower mortality each year – in other words, negative growth rates. Before 1980, countries with the worst mortality rates were making progress at a rate of nearly five fewer deaths per 1,000 children every year. For example, children in Swaziland in 1960 had a 22% chance of not living to see their fifth birthday – but after 20 years with progress of 4.9 fewer deaths every year, by 1980 those children had only a 12% chance of dying before age five: the odds against them had been cut nearly in half. But after 1980, high-mortality countries saw its progress against childhood death slow to only 3.1 fewer deaths per 1,000 children every year. At that rate, Swaziland’s progress would have taken it more than 31 years to achieve. But from 2000 to 2009, progress took off again, and reached the same level it had before 1980: a remarkable rebound. The second quintile hasn’t seen its progress reach quite the level it had from 1960 to 1980, but Quintiles 3 and 4 have actually surpassed the progress of their early years.ii Unfortunately, progress on adult health has not rebounded as much, due in large part to the HIV/AIDS crisis.
Progress on education is looking up too:
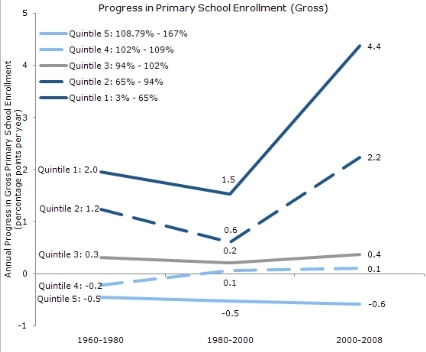
Primary school enrollment shows the same “V” shaped progress for low-enrollment countries. Before 1980, those countries’ enrollment rates were rising by two percentage points per year. The Central African Republic was in this group: in 1960, only one student was in school for every three primary-school-age children in the country. But after 20 years of growing at about 2 percentage points annually, the enrollment rate had doubled to over 70 percent. From 1980 to 2000, progress among low-enrollment countries slowed to only 1.5 percentage points a year but after 2000, it shot back up, to over 4 percentage points per year. The next quintile up saw its progress fall in half from 1.2 to 0.6 percentage points per year, but after 2000 it more than tripled, to over 2 percentage points per year.
It remains to be seen whether the next decade will be able to match or exceed the progress that has been seen since 2000. Nonetheless, the past decade marks a significant break from the long period of economic policy failure that most low- and middle-income countries experienced from 1980 to 2000.
i We measured progress on a country-by-country basis, so small countries are as important as large ones. Economic policymaking happens at the level of individual governments, so if 100 countries enact similar reforms, and the vast majority experience economic failure, this is stronger evidence than success in one large country. We avoid the pitfall of diminishing returns, by comparing countries at the same development level across different time periods. A country that starts out poor would be placed with poor countries in 1960, and if it becomes rich by 2000 it will be placed with rich countries after that point.
ii Quintile 5 is empty for the first time period, because there weren’t any countries in 1960 with low enough child mortality to qualify for that quintile.

